
Monitor runs and traces
When a run fails — or you just want to see what happened — this page shows you how to read its history, diagnose the failure step by step, and open the full execution trace. Every workflow run is recorded with its logs, output, and steps, and traced runs add a full execution trace showing everything Ronja did and where the time went.
Browse run history
Section titled “Browse run history”- Open the workflow — from its feature hub row, an exploration panel, or a link in chat.
- Scan the Activity list: each row is one run, with a status dot, a one-line summary, who ran it, and its duration. Statuses: Running, Waiting, Continued, Success, Warnings, Failed. A run that is waiting on a person reads Awaiting approval instead of Waiting. Any chart or picture a finished run drew is shown under its row, alongside the download links for the run’s other files — you do not have to expand the row to see it.
- Click a row to expand its inline log / output / details tabs.
- Click Open full for the full run page — stat tiles (DURATION / TRIGGERED BY / RESULT / VERSION), tabs Output / Steps / Log, and the parameters used.
A run that wrote tables lists them under Produces in its output, at most 20 at a time, with Showing 20 of N tables when it wrote more. On the full run page, Show all N lists every one; anywhere else, Open the run takes you to that page.
A run that succeeded can carry the amber Warnings from this run box too, so when a value in a run’s output is unexpectedly empty, open the run and check it — see Read a failed run for what its lines mean.
An automation’s run history uses the same list and adds statuses of its own that a workflow’s own history never shows. Skipped is a fire that ran nothing, usually because the workflow or Saved Agent it points at was already running, or because the automation was turned off, changed or deleted while Ronja waited to retry a workflow start; one your organization’s daily AI safety limit paused is labelled Paused — daily AI safety limit, and one its monthly budget stopped is labelled Paused — monthly budget used — see A run that was Skipped. Sender refused appears only on an Email-triggered automation: mail arrived from a sender its allowlist does not name, so nothing ran and the sender’s domain is recorded. Neither is a failure. See When an email trigger turns a sender away. A workflow run someone cancelled reads Cancelled there, in the grey of a skipped run — see Cancel a run on dedicated compute; it is not a failure either.
Run history goes back 1 year. Older runs are cleared automatically, together with their logs — except that a workflow which pauses and continues is kept as a whole while its chain is still running, so a long-running pipeline never loses its earlier steps. See Limits and retention.
The mini-stats cover recent runs, not lifetime history — with one exception on a workflow. A workflow’s page shows them as Average duration, Success rate and Runs; its panel shows the same three as AVG, SUCCESS and RUNS. On a workflow’s page and in its panel, the run count covers every run in the workflow’s history, while the average, the success rate and the Activity list cover the newest 100 runs. When there are more, the average and the success rate say so under their values: the average reads last 100 runs, and the success rate reads, for example, of 97 finished in the last 100 runs. The Activity list then ends with Showing the newest 100 of N runs. A run that is still going — Running or Waiting — is left out of the success rate entirely rather than counted against it, and so is a Continued one (its successor is in the same list, and counting both would count one piece of work twice). On an automation a Skipped, Sender refused or Cancelled entry is left out too: there is no outcome of the automation’s to count either way. A workflow run someone cancelled is different on the workflow’s own page: it reads Failed there and counts against the workflow’s Success rate. That is why the success rate names the number of runs it was worked out over, which can be smaller than the run count. A run that spent part of its life Waiting — on a timer, on a mid-run approval, or on an answer from a colleague — reports the whole time from when it started to when it finished, so a long wait shows as a long run and can lift the average well above what the work itself took. That is expected, not a stuck job. So is a run that writes many tables staying Running after its code has finished: it is marked done only once every table is saved, which for a run writing a thousand tables takes some minutes.
A run that is Waiting
Section titled “A run that is Waiting”Two kinds of run pause mid-way and pick up later on their own. Either sits at Waiting, with a steady blue dot rather than the pulsing one a Running run gets. (A third kind of pause waits for a person instead — see A run that is awaiting approval.)
- A Durable workflow hands work to an agent, or waits until a given time, and stops there.
- An agent — a saved Agent, or the agent an automation runs — decides it has nothing useful to do until something else finishes, and comes back to it. It might be waiting on a workflow it started, on another agent, or simply for a set amount of time.
In both cases nothing has gone wrong and nothing needs doing. The work already finished at that point is saved — files and tables written before pausing are on the run already — and Ronja restarts it by itself as soon as what it was waiting for happens. The steps that already ran are not repeated when it continues.
Where they differ is what you see when the wait ends. A paused workflow carries on in a new run entry, and the paused one is marked Continued — finished with, never a failure. Read the newer entry for the outcome; a workflow that pauses several times leaves a Continued entry for each pause, and the newest one is the live one. A paused agent simply carries on in the same run entry: it goes back to Running and then to its final status, so there is nothing extra to open.
The trace does not split like the run entries do. However many times a workflow pauses, the whole pipeline stays one execution trace — it sits at Waiting between pauses and shows one Workflow run block per continuation, in order, on one time axis. So there is one row to find in the trace list and one timeline to read, whether the pipeline ran straight through or stopped nine times along the way.
Ronja gives up eventually rather than waiting forever. A workflow still waiting 14 days after it was due to continue is marked Failed with a message saying why — and so is one that has been pausing and continuing for more than about eleven months, however healthy each pause looked. An agent waits on a shorter leash — at most a day at a time, and no more than three days across a whole run — because a job that genuinely needs checking over days belongs in an automation on a schedule rather than in one long-running agent. See Limits and retention.
You will see Waiting on a workflow only if it uses durable execution and its author wrote it to wait for something; on an agent run, only when the agent decided waiting was the right thing to do.
A run that is awaiting approval
Section titled “A run that is awaiting approval”A Durable workflow can also stop part-way through and ask a person to decide before it goes any further — usually right before the step that does something consequential. The run stays Waiting, but its status reads Awaiting approval, and in the Steps tab the step it stopped on reads awaiting approval. Everything before that step is finished and saved; nothing after it has run.
This is how a workflow asks for sign-off: at one particular step, and only when it gets there — so the run works the same however it was started, from the workflow’s page, an app, or an automation. (A handful of older workflows instead carry a legacy Pre-run approval gate that stops every run before it starts; see Approval before a run.) The approver’s side of this is Approve a workflow run.
Decide on the run page
Section titled “Decide on the run page”Open the run and a card sits above the run activity:
- Read the headline — it is the question the workflow is asking — under the eyebrow Awaiting approval.
- Check the context rows below it: the details the workflow put in front of you to decide on.
- Note the deadline, shown as Expires in 6 days.
- Add a note in Comment if it helps — “Add an optional note for whoever started this run…”. It’s optional.
- Click Approve or Reject. A toast confirms it — Run approved or Run rejected — and the card keeps the decision, stated in full: You approved this on 21 Aug 2026 at 16:29 (or the decider’s name instead of “You”), the question underneath, then the comment. The context rows fold away behind a Details link once the decision is made — they are there for whoever has to decide, not for the record afterwards.
Who can decide
Section titled “Who can decide”- Named approvers — the people this decision was addressed to — see both buttons.
- Admins can always decide, named or not.
- Anyone else who can open the run can stop it but not let it through: the line reads Awaiting approval from {names} — you can stop this run, but not approve it. Where you can’t act at all it simply reads Awaiting approval from {names}.
A named approver who has no access to the workflow itself still gets the card, with a note saying so: You don’t have access to the rest of this run — only the approval above. You can decide the question you were asked without being given the rest of the run — and you see only the questions addressed to you, not any others the same run raised for other people.
What each choice does
Section titled “What each choice does”| Choice | What happens |
|---|---|
| Approve | The run carries on from where it stopped. The steps that already finished aren’t repeated |
| Reject | The run fails, with ApprovalRejected — unless the workflow was written to handle a rejection and carry on differently |
| Nobody decides in time | The request expires and the run fails. The deadline is 7 days by default and 14 days at most — see Limits and retention |
How approvers hear about it
Section titled “How approvers hear about it”Approvers get an email — or a Slack message, if the workflow’s approval settings route there — with the question and a single Review and decide link to the run page. You sign in and decide there; nothing is decided from the message itself.
Admins also see it in the Inbox on the Shared features page, as a RUN APPROVAL row: “{workflow} run is waiting for a decision”, with how long is left and how many approvers were asked. Clicking it opens the run page — the Inbox lists it, but the decision happens on the run.
If the workflow asked nobody — it named no approvers at that step, and none are set on the workflow itself to fall back on — the run fails right there with an error saying so. Ask whoever built it to name who should be asked.
A run that was Skipped
Section titled “A run that was Skipped”Skipped is a status you see in an automation’s run history, and only there. It means the automation fired and nothing ran, or that the daily AI safety limit or the monthly budget stopped it. Usually that is because the workflow or Saved Agent it points at is set to Skip if a run is in progress, one of that resource’s runs was still going, and this fire was refused. The run already going was never touched; it is the late one that was turned away. It is also recorded when the automation was turned off, changed or deleted while Ronja waited to retry a workflow it couldn’t start — those summaries begin “Not retried:” — and, on a Table automation, when a catch-up re-run Ronja had queued found every table it watched deleted before it could run.
For a refused fire, the row’s summary names the run that was in the way, so you can open that one and see what it is doing. There is nothing to fix: the entry is a record that the setting did its job. Every refused fire leaves one entry, whichever trigger kind fired it.
A Table automation re-runs itself. A Table automation refused because its target was already running runs once more shortly after that run finishes, however many changes arrived meanwhile — so there is nothing for you to re-run either, and the catch-up appears in the history as an ordinary run of its own. The summary of the Skipped entry says a re-run is queued. The exception is an automation that changes a table it watches: if its last three runs that actually ran were all such re-runs, the entry says it was not re-queued instead, which is the automation being stopped from chasing its own writes. A catch-up that is itself refused — its target had started another run by the time it came round — is not queued again either, and its entry says so; the next change to a watched table fires fresh. For every other trigger a refused fire is simply turned away — the schedule comes round again, and an inbound email or webhook that was refused is not replayed.
One other way to get a Skipped entry is to turn off, change or delete an automation while Ronja is waiting to retry a workflow it couldn’t start (see Read a failed run). The summary then begins “Not retried:” and says which of the three you did. That entry names no run to open: the start that failed is in the workflow’s own run list.
A third way is the tail end of a catch-up: a Table automation’s queued re-run reaches the front of the queue and every table it was watching has been deleted in the meantime, so there is nothing left to catch up on. That takes a particular sequence, because Ronja refuses to delete a table while an automation watches it — the automation has to have been pointed at other tables first, and the ones it used to watch deleted after that. That entry names no blocking run either, and there is nothing to do about it — the automation itself is the thing to revisit, since it now watches nothing.
The fourth kind is labelled Paused — daily AI safety limit rather than Skipped. Your organization’s daily AI safety limit had paused AI: the automation’s Saved Agent couldn’t start or was stopped part-way, or its workflow failed on an AI step the pause refused. The summary says AI is paused and when it resumes. For a workflow, the entry links the workflow run, which reads Failed with the same explanation as its error and the script’s own error line at the end of its log; a workflow that caught the refusal and still produced its output completes as usual. It names no blocking run, and unlike a refused Table fire it is not run again later, whatever the trigger: a schedule runs at its next time, and an email, webhook, event, table change or mailbox message that arrived during the pause is not replayed, and what it carried is not kept. Run now starts the automation again without it once AI resumes; for an email or webhook that mattered, have it sent again once AI resumes, or ask Ronja to handle it. Automations that run a workflow without AI are not paused.
The fifth kind is labelled Paused — monthly budget used. Your organization had used its monthly budget when the automation fired, which stops every new run, with or without AI, so nothing ran. The summary says the budget is used up and when new runs resume. It names no blocking run, sends no failure alert (admins get the budget’s own emails instead), and it is not run again later, whatever the trigger: a schedule runs at its next time, and an email, webhook, event, table change or mailbox message that arrived meanwhile is not replayed. Run now starts the automation again once the budget allows: an admin has raised it, or the next billing period has started.
Whichever of the five it is, a skipped entry sits in the same muted grey as a rate-limited run rather than the red of a failure, it is left out of the SUCCESS mini-stat, and it never counts towards a run of failures — so an automation that skips half its fires is not reported as failing.
There is nothing to read inside a Skipped entry either — no logs, no steps, no output, because no work was done. (A run the daily AI safety limit paused after it started is the one exception: a Saved Agent stopped part-way through, or a workflow whose linked run holds its log.) For a refused fire, the entry and the run it names are the whole record; open that run to see what is actually happening. The other kinds name no run at all — the summary itself is the record.
A workflow or a Saved Agent leaves no such entry. When one of those is set to Skip if a run is in progress and a start is refused, no run is recorded at all — nothing ran, so there is nothing to put in the history. The caller is told there and then which run is in the way: a person sees the refusal on the page they started it from, and an app or a script gets an error back. An automation’s run history is the only place a refusal is written down.
If you wanted both to go, the thing to change is the workflow’s or the Saved Agent’s setting, not the automation — the automation has none of its own. Ask Ronja — “let the nightly sync overlap again” — since both pages show the value read-only. See Concurrency for a workflow, Concurrency for a Saved Agent, and Concurrency for how the two reach an automation.
Cancel a run on dedicated compute
Section titled “Cancel a run on dedicated compute”A workflow run on dedicated compute can run for up to 4 hours (see Limits and retention), so you can stop one that is no longer wanted rather than wait for it.
- Open the workflow. For a run an automation started, open the automation and click Runs a workflow under Action.
- In the workflow’s Activity list, click the running run’s row, then Open full.
- Read the line above the stat tiles: Running for 1h 12m on dedicated compute, with Started and the time it began.
- Click Cancel.
- Read Cancel this run? and click Cancel run — or Keep running to leave it alone.
The line then reads Cancelling… until the machine has stopped, and the run ends as cancelled: its summary reads Cancelled by with your name and how long it had run, for example “Cancelled by Ada Lindqvist after 1h 12m”. In the workflow’s run list it still reads Failed and counts against the workflow’s Success rate, but it is not reported as a failure: nobody is notified or emailed about it, and if an automation started it, the automation’s run reads Cancelled, in the grey of a skipped run, and does not count towards a run of failures.
In an automation’s Recent runs, a running run’s entry shows the same Running for … line and its own Cancel, which asks the same question.
What a cancel cannot undo:
- Anything the run already did — an email it sent, a file it saved, a table it wrote — stays done.
- A run that has just finished keeps its results. If the run’s work ended before the cancel reached it, the run ends as it would have, and the line reads Saving its results; it can no longer be cancelled while Ronja saves them.
If Ronja recorded your cancel but could not reach the machine, a message reads Ronja recorded your cancel but could not stop the machine yet; it will keep trying. There is nothing more to do: the run reads Cancelling… and ends as cancelled once its machine has stopped.
A Durable workflow that was just about to pause when you cancelled it — to wait or for an approval — can pause instead of ending: its run reads Waiting or Awaiting approval rather than Cancelled by, and later carries on in a new run entry. To stop it, click Reject if it is awaiting approval; if it is waiting, cancel the run that continues it once that run starts.
Who can cancel: anyone who can run the workflow — every role but User Read-Only — can cancel any of its runs, whoever started it. A User Read-Only member sees how long the run has been going, but no Cancel. Only a person can cancel: from the run page or an automation’s Recent runs, or over the API with a token of their own; an automation’s or a script’s token cannot.
Only a run on dedicated compute can be cancelled. A run on standard compute ends within 10 minutes anyway, so it has no Cancel. Nor does a run that is Waiting: nothing is running while it waits.
Read a failed run
Section titled “Read a failed run”- Expand the failed row — its summary line is the error itself, and the details tab shows the parameters used.
- Open the Log tab: a terminal view with error lines highlighted, plus Copy and Download.
- Open the Steps tab: the failing step carries a red failed pill — expand it for the full Error block and that step’s own log.
- Read the amber Warnings from this run box, above the run activity, when there is one: notes the run itself raised. Nothing there failed the run — it kept going. Some lines say what the run could not do, which a re-run would do differently. Others say what the run had to change to deliver its result: a number that was not a real number — a missing value, or the result of a division by zero — is delivered as null, an empty value that is not the same as zero, and the line says how many numbers were not finite. If the difference matters, ask Ronja, or whoever built the workflow, to handle missing values or divisions by zero before the workflow returns its result.
- Look for an amber not journaled chip beside a step in the Steps tab. That step ran, but its result was not recorded, so a re-run does that work again instead of reusing it. Hover the chip for the reason.
- Check the header if the run succeeded but shows a yellow degraded badge: a best-effort step failed without sinking the run, and the Steps tab tells you which one.
- Click the re-run icon (top right) to replay the run with the same parameters.
If Ronja can’t start the workflow an automation runs, Ronja tries once more about a minute later, whatever the trigger. The automation’s run stays running while it waits, its summary says it was retried, its duration includes that minute, and a failure is reported only if that second try fails too. The workflow’s own run list still shows that first start as failed, even when the second try succeeded.
A run you start with Run now gets the second try too. A test run Ronja makes while setting the automation up with you does not, and neither does a run whose workflow had already started. If you turn the automation off, change the workflow or parameter values it runs, or delete it during that minute, the run is recorded as Skipped (editing only its schedule, name or trigger does not stop the second try); if your organization runs out of credits, or the workflow is deleted or its parameters no longer match the automation’s, the run fails without a second try.
A durable workflow remembers what each step produced: when you re-run one after a failure, the steps that already succeeded come back marked cached in the Steps tab — Ronja reused the recorded result instead of doing that work again, so the run picks up where it broke. Not every step can be remembered, and the ones that could not say so: a step marked not journaled is one whose result was too large, or of a kind that cannot be stored, or something that must not be written down at all — that step is simply done again on the re-run.
That memory covers what the workflow sent, not just what it computed — but it works differently there, and the difference decides what a re-run does to the people the job contacts. An email, a notification, an upload or a call out to another system is recognised by its own content: if the re-run would send exactly what already went out, it is not sent again. If the data behind it moved in the meantime — a figure recalculated, a row edited, a list re-ordered — what the re-run would send is no longer the same message, so it goes out. On a job that got halfway through notifying a hundred customers, the fifty already mailed are mailed a second time if what they would receive has changed since. When that matters, check what has changed since the failure before you re-run.
There is a second way a send can be written, and it behaves the opposite way round: whoever builds the workflow can give a send a fixed identity — one tied to the thing it is about, such as the invoice it concerns — rather than letting its own content identify it. A send pinned that way is never repeated on a re-run, even when the figures behind it have changed. So if you are re-running specifically to get corrected figures out to people, ask whoever built the workflow which way its sends are written; re-running is not on its own enough to guarantee the corrected message goes. Rows and files the workflow produces are always written afresh, so a re-run still leaves you with a complete set of outputs.
Open the execution trace
Section titled “Open the execution trace”- Click View trace in the run page header (shown when the run was traced). The page is titled with the run’s name.
- Read the status chip beside the name and the status line under it:
- Running for a duration that counts up while the run is still going, with “N issues so far” once a step has failed. The chip reads running.
- Paused, not finished while the run waits, for example on a person’s answer or on a timer. The chip reads waiting.
- Completed — no issues or Completed with N issues once it has ended. The chip reads healthy or degraded.
- Failed or Skipped, followed by the run’s own message, for example “Cancelled by Ada after 12m”. A skipped run whose steps failed reads, for example, Skipped · 2 issues. The chip reads failed or skipped.
- Read the facts line below it: when the run started, how long it took and when it finished (both shown only once it has ended), how many steps it ran, and how many of them ran in parallel.
- Scan the waterfall: one row per step in the causal chain — an Automation trigger, the Workflow run, each Step, any AI agent work — all on one shared time axis. Bars are grey; a failed step’s bar is red, an alert’s bar is amber, and a step that is still running has a striped bar. A bracket and “· N at once” mark steps that ran at the same time. A workflow that paused and continued shows one Workflow run block per continuation.
- Click a failed step’s error line under its row to see the full error text and, for a workflow run, its logs.
While the run is going, the page updates itself as each step starts and ends, so you don’t need to reload it. If live updates aren’t available, the facts line says “Live updates unavailable — refreshing every minute” and the page refreshes once a minute instead. If a refresh fails, the page keeps showing the trace and the facts line says “Couldn’t refresh — showing the trace as of” the time it last loaded; the durations stop counting until a refresh succeeds. If you lose access to the trace, or it is removed, while the page is open, the page switches to “You don’t have access to this trace” or “Trace not found”.
On a very large trace, not every step is shown: the facts line reads “N+ steps · some not shown”, and a note under the waterfall says the trace exceeded the display limit.
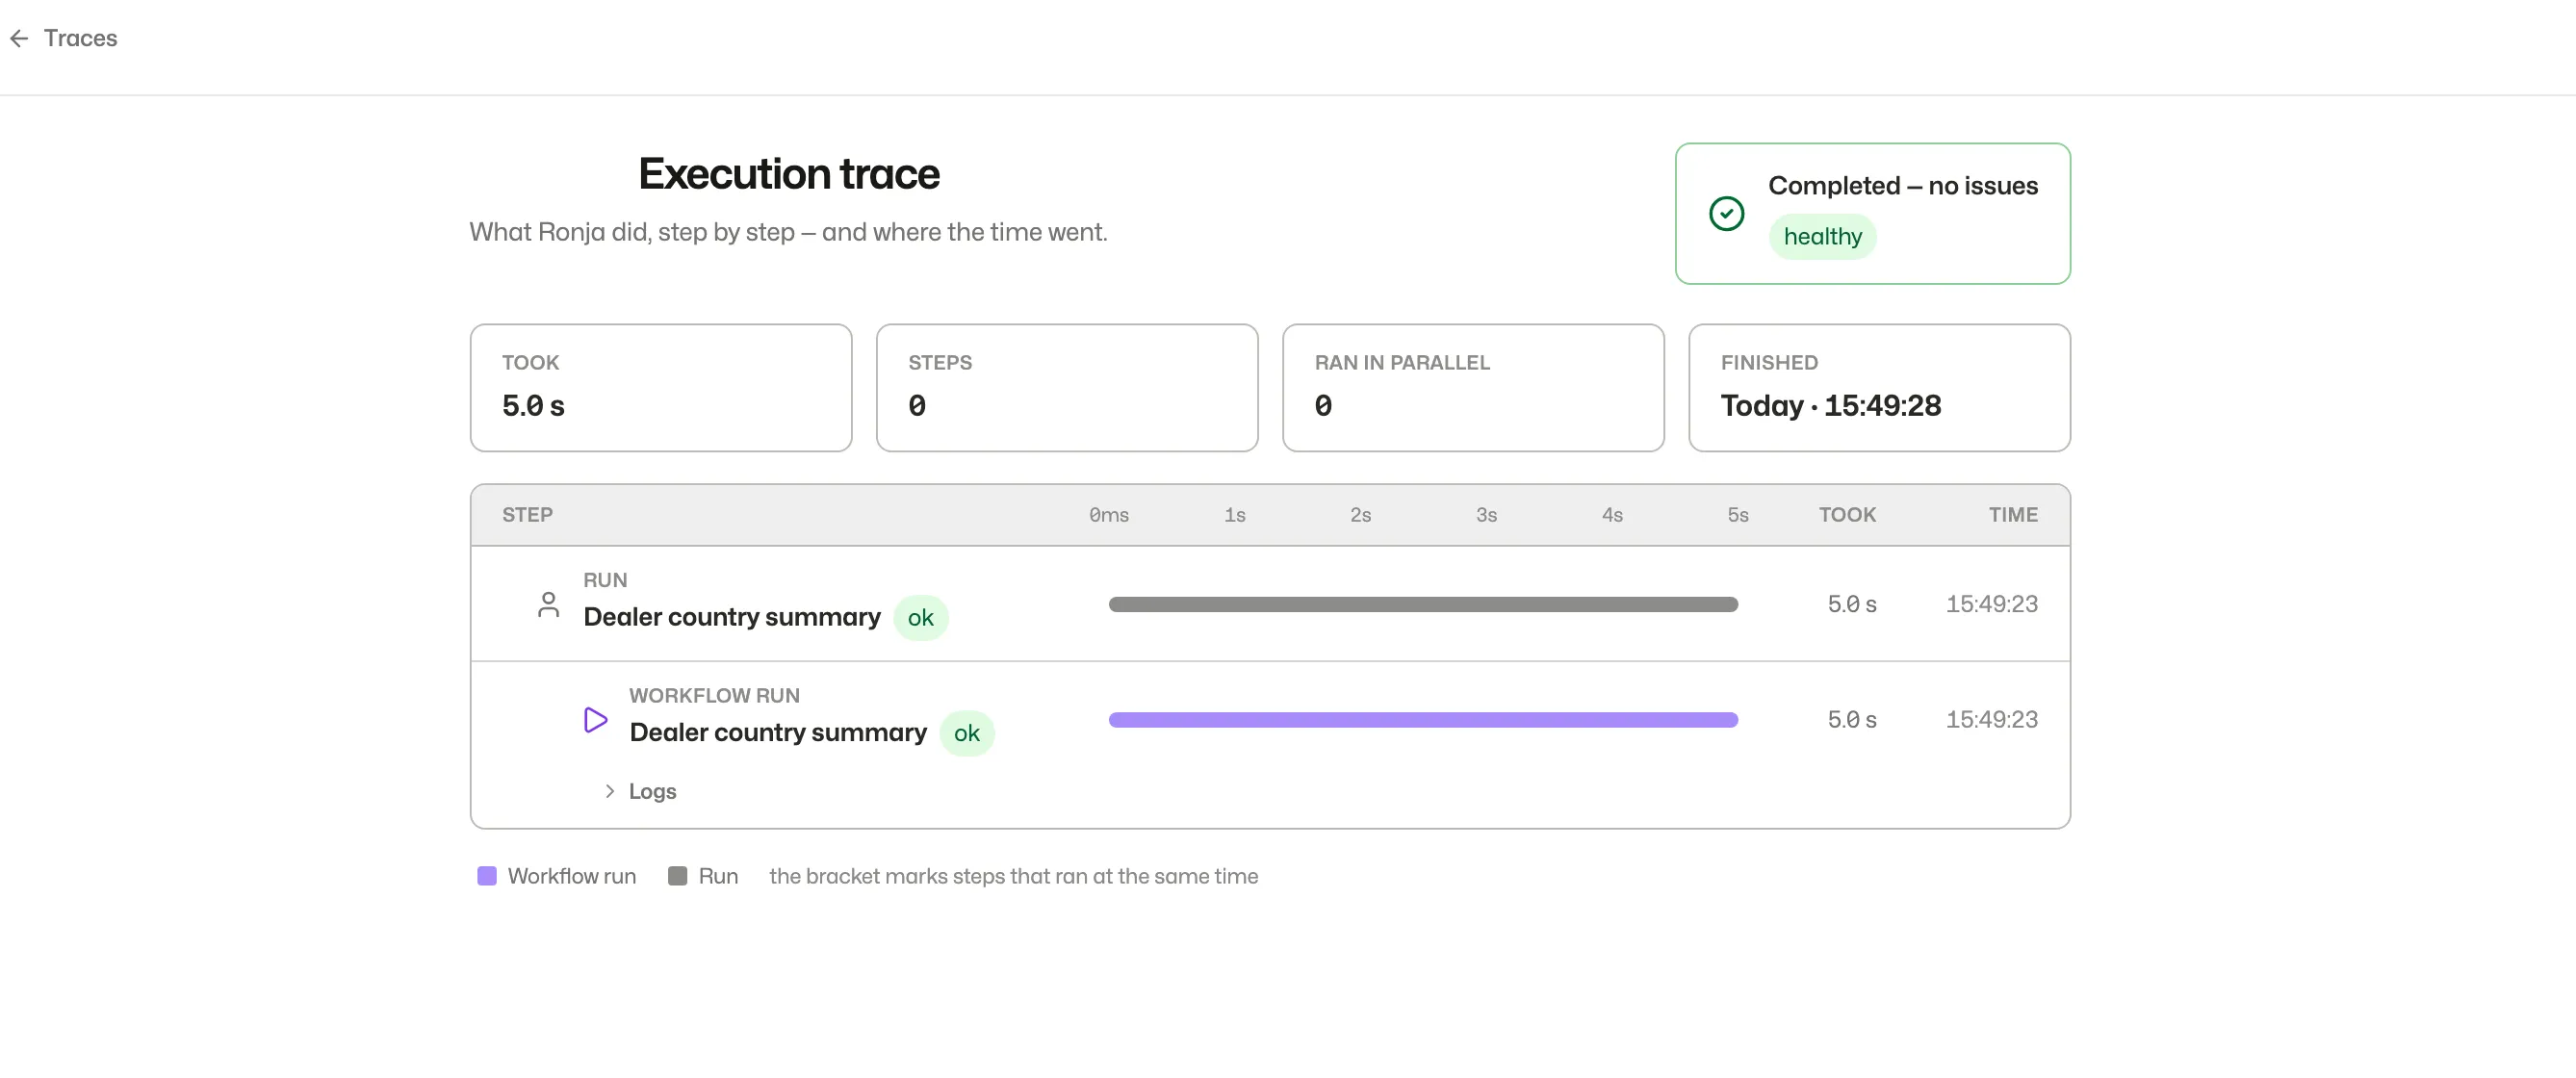 The execution trace: what the run did, step by step, and where the time went.
When a run reacts to an emitted event, the trace shows how it connects to others. A Triggered by line under the status links back to the trace that emitted the event this run reacted to, and a Triggered {N} automations line links forward to each trace an event from this run set off — click any link to open that trace. A link to a trace you can’t open shows as a locked marker reading “A run you don’t have access to”.
In an exploration
Section titled “In an exploration”- Click the pinned Runs entry on the session’s rail — it lists every workflow and Saved Agent run this conversation spawned.
- Click a row to open its trace in a docked panel. Run cards in chat also carry their own View trace button.
Organization-wide (admins)
Section titled “Organization-wide (admins)”Admins can open the Runs & Traces page in the sidebar’s Activity group for a newest-first list of every execution trace in the organization, with Load more paging — see Activity log.