
Metrics
Every company has the same argument: what’s our actual revenue number? One report says one thing, a spreadsheet says another, and nobody’s sure which to trust. A metric is Ronja’s answer — the single, agreed way to calculate a number like Monthly Recurring Revenue, churn, or active users, with one definition the whole company shares, traceable all the way down to its source data.
You don’t write SQL to make one. You describe it, Ronja builds it, and an admin verifies it — after which it carries a visible trust badge so everyone knows they can rely on it.
What makes a metric different from a table
Section titled “What makes a metric different from a table”A metric looks a bit like a table — in fact it’s a special kind of one — but it behaves differently in three ways that matter:
- It’s a definition, not a stored result. A table holds rows. A metric holds a recipe — “sum
net_sek, divide by the count of orders, anchored onorder_date.” Ronja recomputes the number from the source data rather than storing an answer; nothing is frozen. Ronja keeps a very short-lived copy of the last result, so a screen that asks over and over isn’t recalculated on every tick — which means the number you read is usually well under a minute old, and never more than a couple of minutes. A rebuild of the source data usually drops the copy sooner than that. - It always shows its trust badge. A metric is either Verified, Unvetted, drifted (“review pending”), or Retired, and it says which at all times. Any table can carry those states — see Verification — but only a metric wears the badge even while unvetted, because for a number the company is asked to trust, “nobody has checked this” is itself worth saying.
- It slices correctly. Because a metric recomputes from source, you can break it down by any dimension or time period and the number stays right — even for a ratio. “Average order value, UK only, 2025” is computed from scratch over exactly those rows, not by re-dividing a pre-baked total (which would be wrong).
The two things a metric tracks
Section titled “The two things a metric tracks”A metric has two independent states, and keeping them separate is the key to the whole feature:
| Axis | Values | Question it answers |
|---|---|---|
| Lifecycle | Live · In progress · Archived | Is it finished being built? |
| Trust | Verified · Review pending · Unvetted · Retired | Can you rely on the number? |
A metric can be fully built and live but still unvetted (nobody has verified it yet). A metric can be verified but drifted — meaning its definition changed since it was last checked, so the endorsement is paused until an admin re-confirms. The two never mean the same thing.
On the Metrics page the two stay apart: the list is grouped into Live, In progress, and Archived sections by lifecycle, and each row carries its trust badge, with the trust chips above the list (All, Verified, Needs review, and so on) to filter by it.
Browsing by tag
Section titled “Browsing by tag”A metric’s two states say whether it is finished and whether you can rely on it. Neither says where the number belongs — to Finance, to Sales, to Operations. That is what tags are for: the same organization-wide labels you put on tables and features, used here to file your metrics. A tag is independent of both states; tagging a metric changes nothing about its lifecycle or its trust.
Once any metric is tagged, a Tags list sits beside the catalog (on a narrow screen it folds into a row of chips above the list):
- Click a tag to show only the metrics carrying it. You filter by one tag at a time; clicking another switches to it.
- Untagged shows the metrics with no tag, so nothing hides behind the filter.
- All, or clicking the selected tag again, clears the filter.
- Each count is how many metrics you’d see if you clicked it, given your current search and trust filter — so the numbers change as you type. The trust chips count the same way, taking the selected tag into account.
Each row shows its tags as neutral chips with colored swatches under the metric’s name (on rows you can’t edit, the first two, then +N for the rest). The search box matches tag names as well as a metric’s name, abbreviation, and description, so typing “finance” also finds the metrics tagged Finance.
Anyone with edit access (the User role or above) can tag a metric right on its row: hover the row and click Tag to open the tag picker, or click the × on a chip to take it off. Archived metrics show their tags but can’t be retagged on the Metrics page (an Admin can from the metric’s own page). You can also set tags when the metric is made — ask Ronja to tag it as she builds it (“make ‘Gross margin’ an official metric and tag it Finance”) and it lands already labeled.
You can also tag metrics without opening the app: list the tags in the metric’s file in a pipeline folder and a push applies them, or add and remove tags over the API with one PATCH /api/v2/tag/of/table/<metric id> request (it needs a token with data:write); the step-by-step guide is served on your Ronja domain at /docs/api/guides/build-a-data-pipeline.md.
Until any metric is tagged there is no Tags list; people who can tag see a short prompt above the list instead: “Tag your metrics — Finance, Sales, Operations — to browse them here.”
Creating a metric
Section titled “Creating a metric”There are two ways in from the app, and both end with Ronja building it with you — there’s no form where you type raw SQL. (A third route, for definitions kept in version control, is below.)
- Open Metrics in the sidebar and click New metric.
- Give it a name (“Net Revenue Retention”), describe how it should be calculated in plain language, and optionally list what you want to break it down by. Ronja can suggest the breakdowns for you. A metric shares its feature’s names with the tables in it, so a name a table there already has is refused — Ronja says which one has it.
- Click Create & request verification. Ronja opens a chat in Build mode, finds the right source table, works out the recipe with you, and creates the metric.
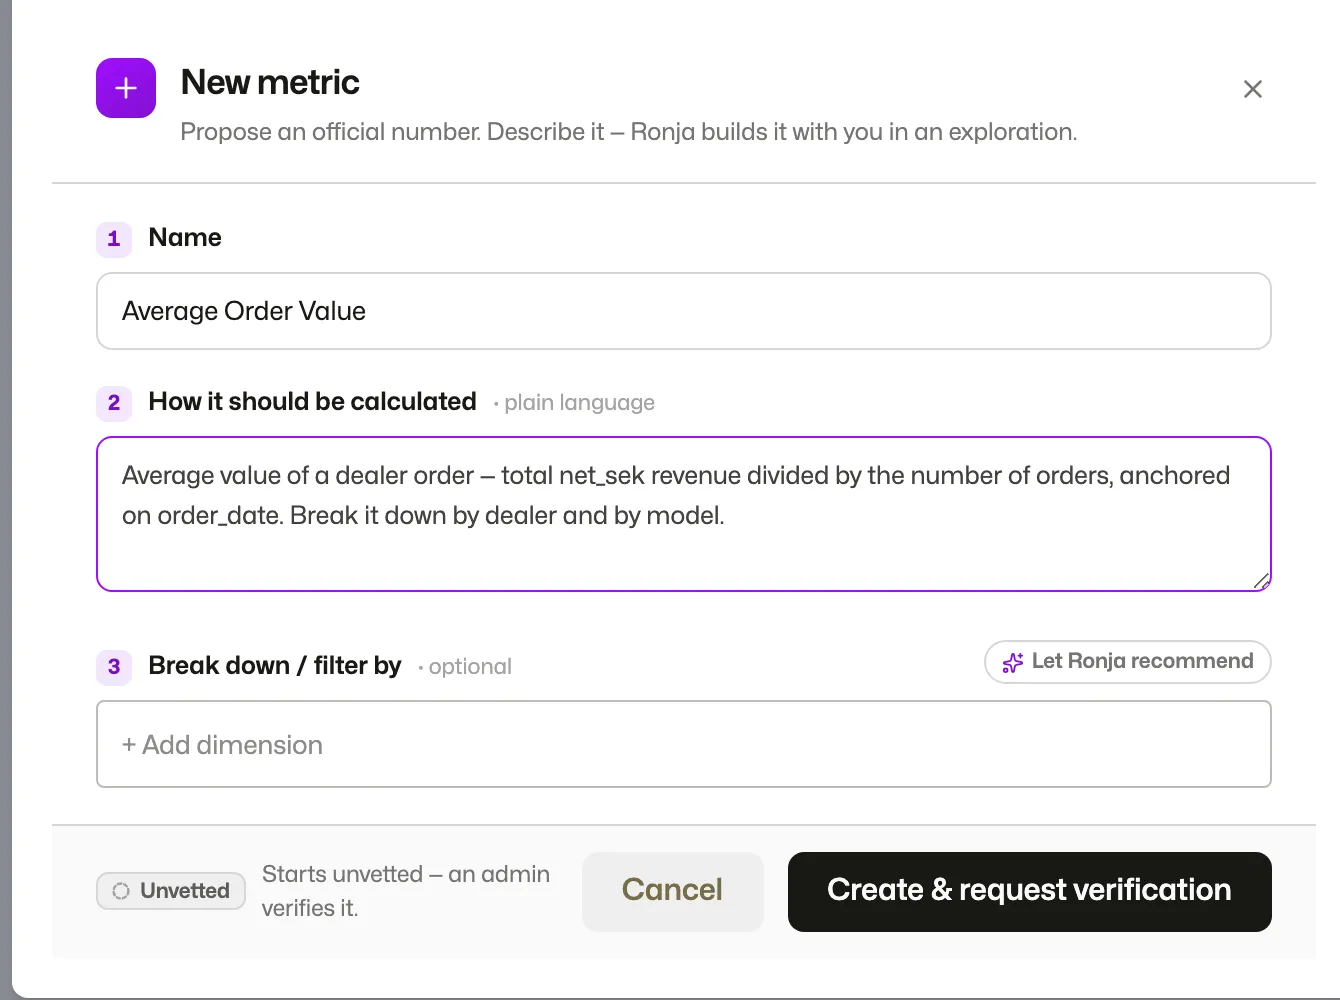 Describe the number in plain language; Ronja builds the definition and an admin verifies it.
You can also just ask Ronja in any chat — “make ‘Average Order Value’ an official metric” — and she’ll do the same thing. (She won’t mint a metric just to answer a one-off question; a metric is a deliberate, governed act.)
Every new metric starts unvetted. Verification is never automatic — that’s what makes the “Verified” badge mean something.
Keeping a definition in version control
Section titled “Keeping a definition in version control”A metric definition can also live in a file in your own git repository, beside the SQL of the tables it reads, and be deployed from there. That is the route to reach for when the definition of a company number should be reviewed in a pull request like any other change, or when the same definition has to exist in more than one organization — a group and its subsidiaries, say — from one committed folder.
It is the same governed thing either way: the file is pushed to your own draft, publishing commits it or asks an admin to, and a definition change still parks a verified metric at “Verified · review pending” until an admin re-confirms it. See Use the Ronja CLI.
What Ronja builds it from
Section titled “What Ronja builds it from”Under the hood, a metric is a small, strict recipe:
- One clean source table. A metric reads from exactly one already-tidy table. If the data needs cleaning, joining, or de-duplicating first, that happens upstream in a prep table — so the metric itself stays simple and auditable.
- A time anchor. Every metric is tied to a date column and a finest grain (day, week, month, quarter, or year), so it can always be shown as a trend.
- Named measures and a formula. Ronja defines the building blocks (e.g.
revenue = sum(net_sek),orders = count(*)) and combines them with simple arithmetic (revenue / orders) — no SQL functions, just the pieces and the math.
Because the formula is explicit, Ronja knows whether a metric is additive (safe to sum across rows, like total revenue) or not (a ratio or a distinct count, like average order value) — and handles slicing correctly either way.
The calendar it counts on
Section titled “The calendar it counts on”A metric also has a reporting timezone — the calendar its day, week, and month buckets fall on. It matters most at month boundaries: an invoice dated the 1st lands in different months depending on which calendar you count it against, and a metric is exactly the kind of number where two colleagues must not get two answers.
So a metric’s calendar is fixed to the metric, not to whoever is looking at it. Everyone in the company sees the same months, whether they’re reading it from Stockholm, London, or New York. New metrics take your organization’s timezone (set by an admin on the Organization rules page in the admin area) and keep it from then on — changing the organization default later doesn’t quietly move the calendar of metrics you already rely on. A metric created before your organization set a timezone, or while it has none, doesn’t have a calendar of its own: it still reads in each viewer’s own timezone, the way it always has. Nothing was switched over for you, so an existing metric’s numbers have not moved — but that also means two colleagues in different countries can still read such a metric differently. Ask Ronja to give it a calendar when it should be one official number.
To change it, ask Ronja in chat. Because the calendar is part of what the number means, changing it counts as changing the definition: a verified metric will show “Verified · review pending” until an admin re-confirms it, exactly as any other edit would.
Verifying and trusting a metric
Section titled “Verifying and trusting a metric”This is where a metric earns its place as an official number. A new metric is Unvetted; an admin reviews it and marks it Verified, after which it shows a green badge and Ronja prefers it when answering KPI questions. If its definition later changes, or an upstream table it depends on changes, it shows amber “Verified · review pending” until an admin acknowledges the change or has it reworked. An admin can also Retire a metric that is no longer the right way to measure something.
Verification is not a metrics-only idea — an admin can verify a table of any kind the same way, and the states, the drift rule, and the search ranking are all shared. Verification covers the mechanics in full.
What is particular to a metric is that its badge is always shown, including Unvetted — a number the company is asked to trust should say where it stands either way, where an ordinary table only shows a badge once it has one worth showing. That holds on the metric’s own page, in the table lists it appears in, and on the Data map; Search (⌘K) results are the one terse surface, showing only Verified or Retired.
Anyone can Report an issue on a metric — a flag icon on its page, with no counterpart on an ordinary table. That notifies the owner and admins for review but, deliberately, does not change the metric’s status: one person’s doubt doesn’t un-verify a company number.
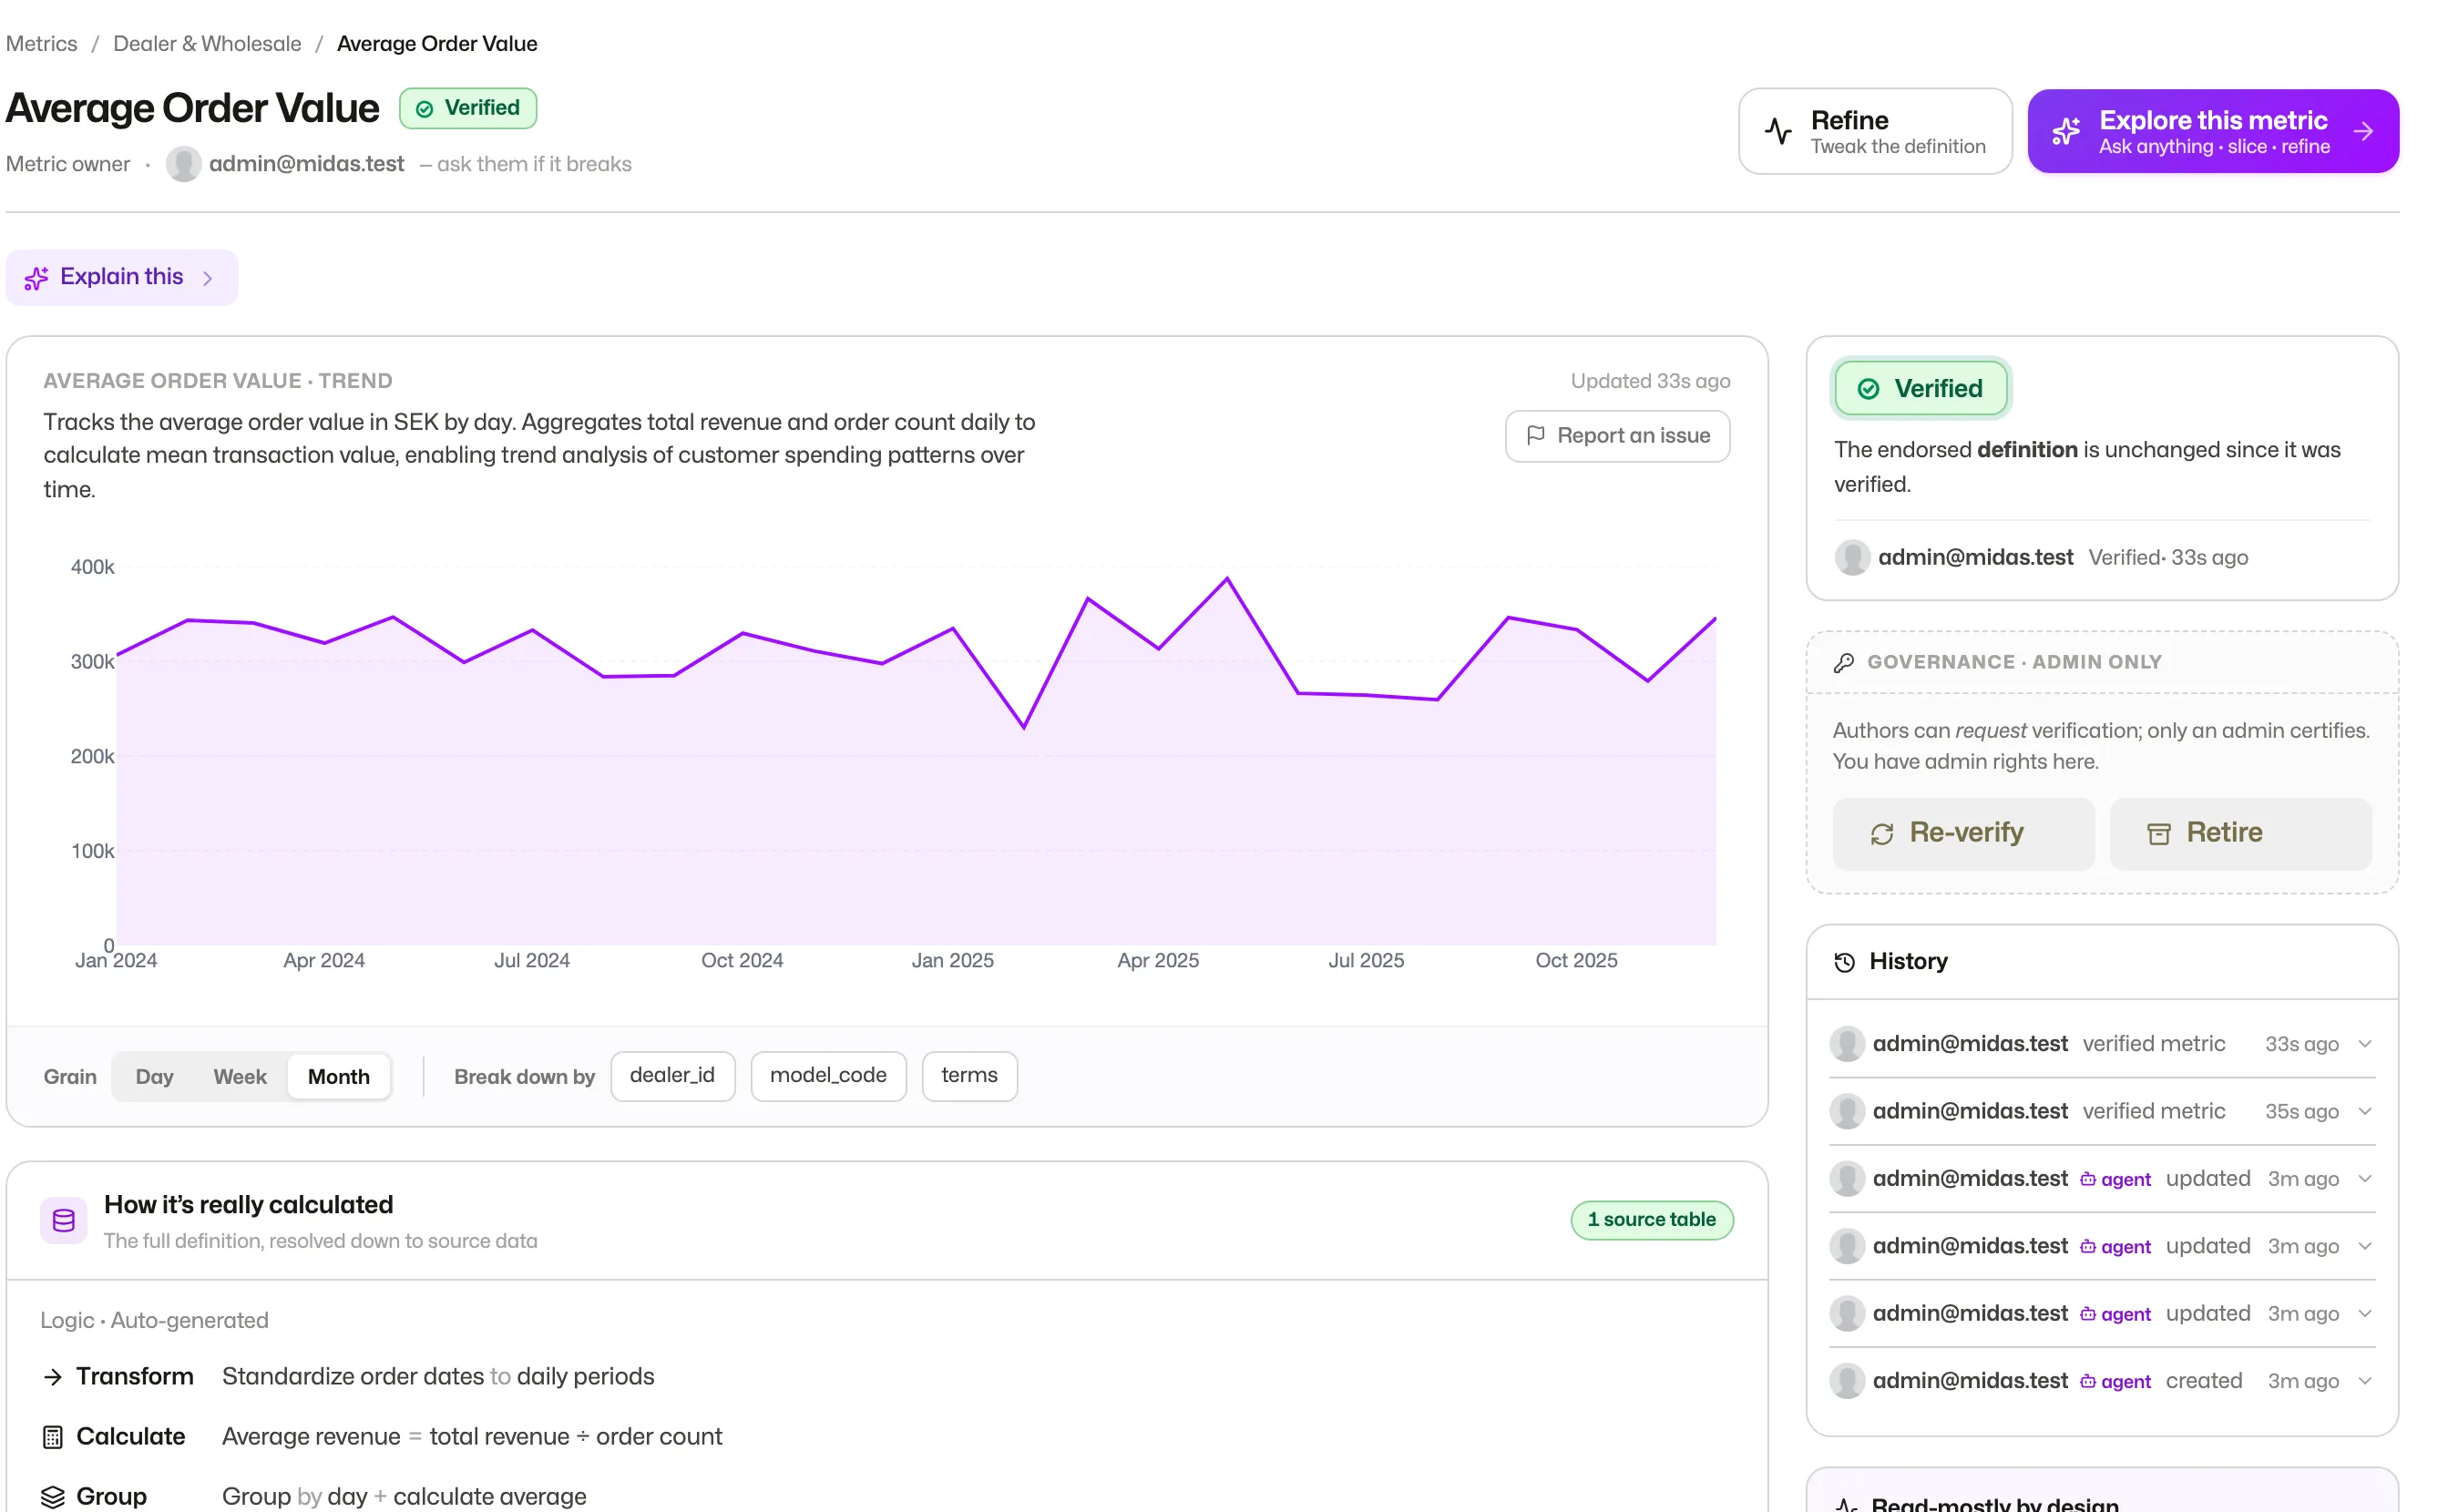 A verified metric: its trend, its trust badge, the slice controls, and the full definition resolved down to source.
Using a metric
Section titled “Using a metric”Open any metric to see its trend chart and slice it: change the grain (day, week, month, quarter, or year — only grains at or coarser than the metric’s finest grain are offered) or pick a breakdown dimension to split it into series. The “How it’s really calculated” panel shows the full definition resolved all the way down to the raw source tables — so there’s never a mystery about where a number comes from.
A gap in a metric’s chart means that point has no value: the slice had no data, or its value couldn’t be computed (for a ratio, a denominator that summed to zero). The metric’s page notes empty points under the chart, and says how many when the chart has more than one point. Ronja is told these points have no value, so she doesn’t read them as 0. A period with no rows at all isn’t drawn, so the line runs straight across it rather than leaving a gap.
When you ask Ronja a KPI question in chat, she’ll answer using the relevant verified metric and show it as a trusted card — and she’ll tell you plainly if the only metric available is unvetted or drifted, rather than passing an unendorsed number off as official.
In chat, a metric’s data table shows — for an empty point, and when Ronja queries a metric the result notes how many points are empty. If the latest periods are empty, the trusted card’s headline shows the most recent figure it has, marked as of that period.
You can also put a metric on an app: ask Ronja to build a KPI app that shows a metric, and the app reads the live, governed definition — so a dashboard-style app displays the official number, and updates automatically whenever the metric’s definition changes.
Each time a metric is worked out — from a chat, from its own page, or through an app — it counts as a read of the metric. You can see that on the Data map: the Usage lens shows how much each metric is read, and selecting one opens its panel with a Reads line. A well-used metric can also appear on the Data tab of the Activity page, where its Kind reads metric.
Its description
Section titled “Its description”Just under the metric’s name, at the top of the chart, sits its description — the plain-English answer to “what is this number, exactly?”. Ronja writes the first one when she builds the metric.
A small marker next to the metric’s name tells you where the description came from: AI means Ronja wrote it, Edited means a colleague did. Everyone sees it — knowing whether a number’s definition was described by a person or by Ronja is part of knowing how far to trust it. Click either marker to read what it means.
An Admin can rewrite it at any time: click the description, type, and click away to save. If there isn’t one yet, the same spot reads Describe what this metric measures… — click it and write. Everyone else sees the description but can’t change it.
Once it’s written, a metric’s description stays put. Ronja writes one when she builds the metric and doesn’t rewrite it afterwards — not when the metric is rebuilt, and not when its definition changes — and she will never write over text a person has written. She can’t be talked into it either: ask her in a chat to change a description a colleague wrote and she’ll say it was written by a person, and point you at the two ways to unlock it — edit it in place here, or hand it back to her with Let Ronja write it again. (A description Ronja wrote herself she’ll happily reword on request.)
So the description is the right place to record the judgement calls a recipe can’t express: which customers count, why a month is a calendar month, what the number is for. The flip side is that it won’t correct itself, so it’s worth a read whenever the metric’s definition moves.
You can also hand the job back. If the written text has gone stale — or was never quite right — an Admin clicks the Edited marker and chooses Let Ronja write it again. Ronja reads the metric’s definition, writes a fresh description on the spot, and the marker returns to AI. If Ronja can’t write one, nothing changes — the existing description is left exactly as it was.
That option appears in the same places the description itself is editable: on the live metric, signed in as an Admin. It isn’t offered on an older version opened from History, or in the side panel inside a chat.
Cumulative view
Section titled “Cumulative view”Some metrics measure change per period — a flow, like Net New MRR (how much recurring revenue you added or lost that month). For those, switch the View control under the chart from Per period to Cumulative to see the running total: each point sums everything up to that date, so the line climbs toward the current standing total. It’s a display choice only — it doesn’t change the metric’s definition.
The View toggle appears only for additive metrics (ones it’s meaningful to add up, like revenue or new sign-ups), and only on a time trend.
Use it on a flow, not a level. Cumulating Net New MRR builds up to your total MRR — that’s the whole point. But cumulating a metric that already measures a standing level — plain MRR, or active users — adds each month’s balance on top of the last and produces a meaningless number. Ronja can’t tell a flow from a level on its own, so that judgement is yours.