
An app your team actually uses
There’s a question your team asks every week. “What does the pipeline look like?” “Where are we against target?” Someone answers it — by re-running the same analysis, screenshotting the same chart, pasting it into the same channel. The answer is good. The process is a tax.
An exploration answers a question once. An app answers it every time anyone opens it — an interactive page with current numbers, filters, and drill-downs, built by Ronja from a conversation and shared with the team like any other resource. Here’s how a repeated question becomes one.
Ask for an app
Section titled “Ask for an app”In an exploration, switch to Build mode and describe what you want. The Apps page itself suggests the shape of the ask: “Build an interactive app to explore our sales pipeline.”
Before anything exists, you stay in control. When the app targets a shared feature, Ronja pauses on an approval card — Create app. Expand it and it names the app: its Name, its Feature, an About line, and the Tables, Secrets and Capabilities it starts with. That is a summary, not an inventory — an app can also start out wired to metrics, workflows, Saved Agents or Codexes, and those don’t get their own row. Approving the card approves creating this app, in that feature, with the starting reach Ronja asked for — so if you want the whole list, ask her to spell it out in chat before you approve.
What approval doesn’t do is freeze the list. As Ronja builds, the app picks up what its code actually reads: write a query against a table and the app gains that table. That’s the point — you asked for an app that answers a question, not for a permissions exercise. It’s safe because of the rule underneath it: Ronja can never add a table you couldn’t open yourself. Every table, secret, metric, workflow and Saved Agent the app picks up is checked against your own access at the moment it’s added, and refused if it’s beyond you. An Admin reaches every table in the organization, so an Admin building an app can wire in a table from a feature no one else reaches yet — and its viewers will then see it, which is exactly why the feature you publish into matters. Ronja can’t widen an app past you, and you can’t widen it past yourself.
The other half of that truth is what makes the rule matter: an app is a grant of access. Anyone who can open the published app sees the numbers it shows, whether or not they could reach those tables directly — the app reads as itself, with the reach you gave it, not with the reach of whoever is looking at it. So the question to ask before publishing isn’t “can Ronja read this”, it’s “should everyone who can reach this feature see this”. (There is no “new app” button anywhere — apps are asked for, and whenever one targets a shared feature, this contract is explicit.)
Watch it take shape
Section titled “Watch it take shape”The app builds in a side panel right next to the chat. First you see the drawing board — a four-step build checklist from “Set up the canvas” through “Sketch the layout” and “Polish & compile” to “Ready to explore” — and the checklist advances as the first files land. As soon as the app compiles cleanly, the panel reloads into the real, running app — as your preview. A new app is an unpublished draft nobody else can see until Ronja asks to Publish 1 app and you click Approve; publishing keeps the same app and the same address, so nothing you have linked to breaks.
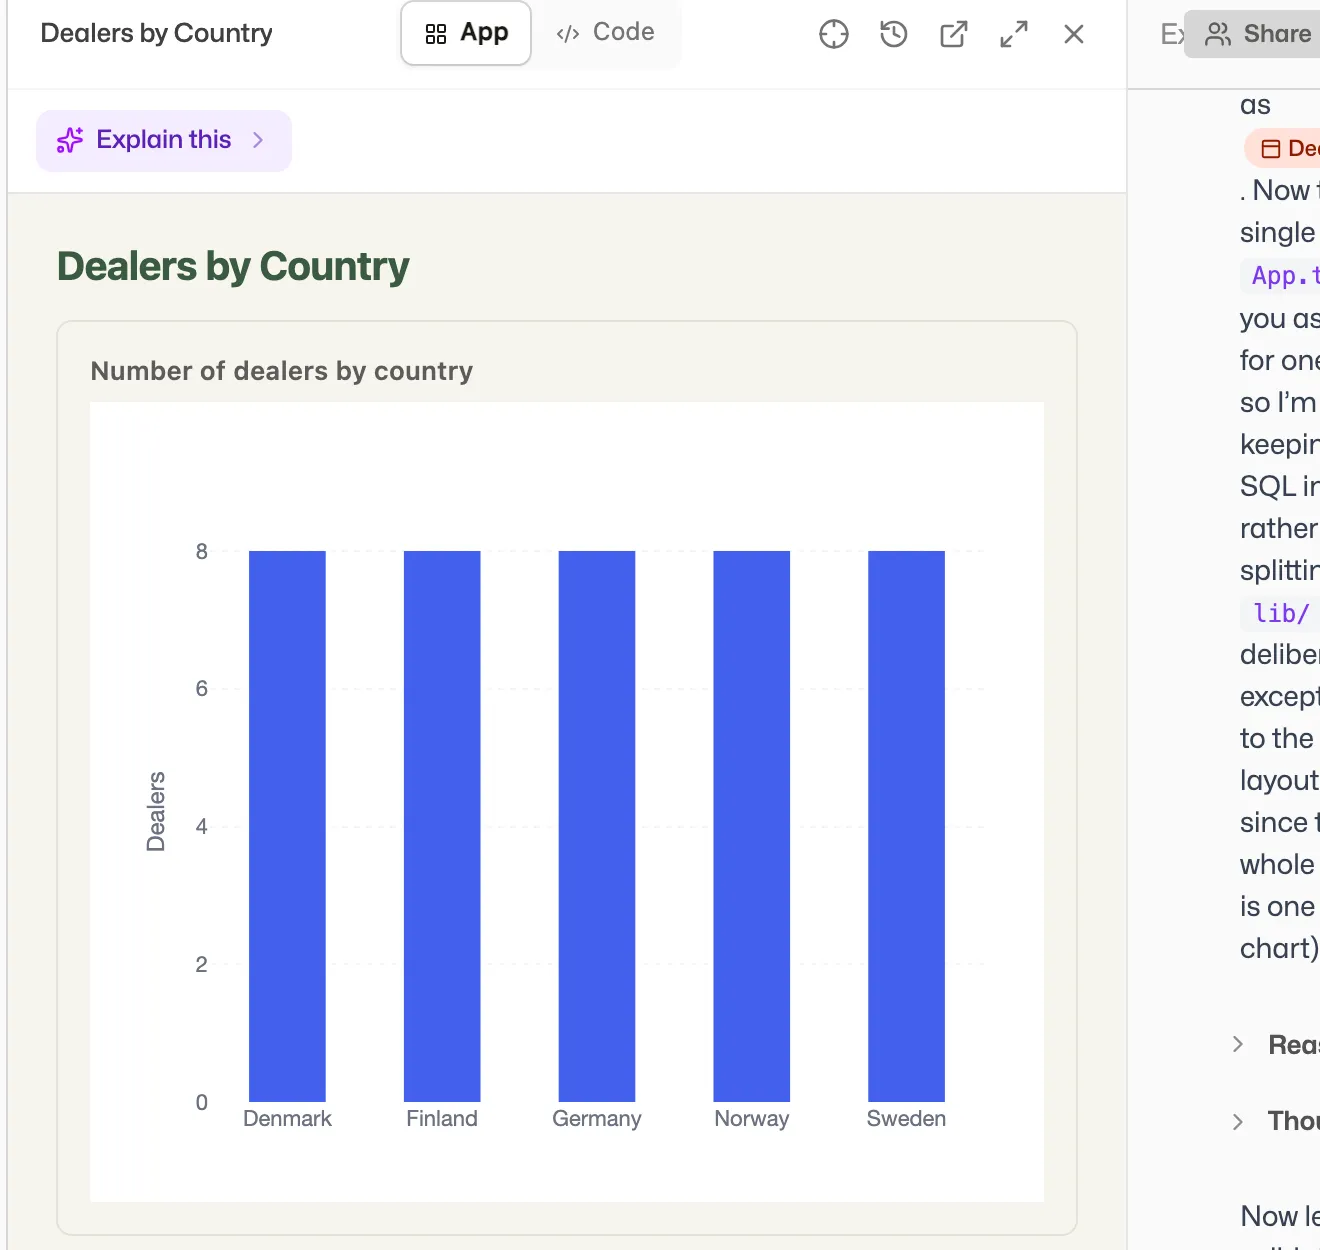 The app takes shape beside the conversation — what you preview is exactly what your team will open.
Iterating is conversational, and unusually direct:
- Point at things. The panel’s element picker lets you click any part of the running app — a chart, a number, a button — and ask Ronja about exactly that. “Make this a weekly view.” “This total looks wrong.”
- Read the code if you like. An App / Code toggle shows every source file, read-only. Nothing is hidden.
- Errors route back to the builder. If the app hits a runtime error, the overlay offers Ask Ronja to fix — the error goes straight into the chat and she takes a look.
And because these are real applications, not static views, they can do things: filters and date pickers, KPI tiles and charts — and even forms. A form can hand its input to a workflow, which writes back to your tables as an inspectable run. Or, when the app has been given a write login to a managed database, it can write rows to that database directly. Either way the write is one the app was given: the workflows it may run and the database logins it may write with (listed as Secrets) are on its Access tab, so nothing writes through a hidden side door.
Make it everyone’s
Section titled “Make it everyone’s”Here’s the part that turns a personal toy into a team asset. An app’s audience is its feature’s audience — there are no per-app permission lists to maintain. On the app’s own page, click Share… and choose: promote the whole feature to the organization, or move just this app into an already-shared feature. Either way the change rides the normal sharing flow, and an admin approves it. If the app is in My Private Feature — where Make my own puts every copy, and where a Saved Agent you build without picking a feature lands — only the move is offered, because that feature can never be shared.
If you’re not an admin, the system stages your work instead of blocking it:
- A brand-new app aimed at a shared feature becomes a proposal — the chat card reads awaiting admin approval, an admin reviews the app (including the tables, secrets and capabilities it ended up with, and the rationale) and approves or rejects it.
- Edits to an already-shared, live app fork into your own private draft with its own link. Edit with Ronja on the app’s page starts one: a Build-mode conversation with the app open beside it. Everyone — you too, at the app’s own link — keeps seeing the working version while you iterate (Preview draft on the banner shows yours); when you’re ready, Submit for review hands the diff to an admin, who can open a preview of your draft before approving. Every committed change is kept as a version that can be restored later.
- Neither of those is what you want when the change is only for you. Make my own on the app’s page gives you an independent copy in your own private feature — no proposal, no review, nobody in the loop — and you edit that instead. See Make your own copy.
The result is something hand-maintained reporting never had: the team’s app can evolve weekly without anyone being able to quietly break it. See Propose and review changes for the full lifecycle.
Publishing says the audience out loud. When Ronja publishes an app in chat — or hands it to an admin for approval — and when you publish one with the CLI, you get one sentence naming who can open it and what they can do: Everyone in your organization can open “NCR register” (its feature “Quality”). Anyone who opens it can read tables “ncr”, “ncr_events” and WRITE via secret “ncr_db write role”. Every viewer gets the same powers — the app cannot tell viewers apart. An app still sitting in a private feature gets the honest version of that: Only you (and admins) can open “Sales pipeline” — its feature “Scratch” is private. Share the feature to give it an audience.
Read the last clause carefully when the app writes anything. An app has one set of powers and every viewer inherits all of them; it cannot show one colleague a read-only view and let another change records. If different people should be able to do different things, keep the changing in a workflow or a Saved Agent that runs as a named person, and let the app do the reading. There is one exception, and it goes the safe way: a link the app offers to open in a new tab — to a file, or to a page in Ronja such as a metric’s — carries the reader’s own access, so a colleague who cannot open the file on the Files page, or the page itself, cannot open it from the app either — the app tells them so, or shows whatever it falls back to.
Where the team meets it
Section titled “Where the team meets it”Once shared, the app is simply there:
- Apps in the sidebar lays out everything you can reach as a grid of cards — each one showing what the app is, the feature it belongs to, and when it last changed. Search it, cut it down to Favorites or Mine, filter by owner or status, then hover a card and click Open.
- Star a card and the app rises into the Pinned section at the top of the page, and into the sidebar’s Favorites.
- Your own unpublished apps gather in a Drafts section under Pinned — that is where a brand-new app sits, visible to nobody but you, until it is published.
- Every app has a standalone page of its own — a stable link you can drop into any channel or doc.
- Every published app also has an address of its own, where it fills the browser tab with no Ronja around it. Open in new tab takes you there in a new tab and Fullscreen in the same one — built for the Monday meeting screen-share or a wall display, and a link a colleague can open directly.
- Work on it spins up a fresh exploration pre-loaded with the app — so the next iteration starts exactly where the last one ended, for anyone with access.
Admins even get an honest answer to “is anyone using this?” — the Apps tab of the Activity page shows each app’s viewers, its reach across the organization, its opens and when it was last opened, lists the people who open it, and picks out the published apps nobody has opened.
Why this sticks
Section titled “Why this sticks”Repeated questions usually die in one of two ways: a BI license nobody renews, or a heroic spreadsheet nobody dares touch. An app built this way avoids both, because it’s made of the platform itself. It’s sandboxed by construction — it reaches only the tables, databases and secrets it was given, and a secret’s value is never written into its code. It’s governed like everything else — proposals, drafts, reviews, versions. And it’s maintained the way it was built: by asking.
The question your team asks every week deserves better than a weekly ritual. Ask Ronja to build the app — then never answer that question by hand again.