
Activity log
The admin sidebar’s Activity group has three pages. Overview opens the Activity page, which shows how your organization uses Ronja — who uses it, what people work on, and which apps and tables they rely on; it has its own guide, Monitor activity and usage. This page covers the other two, the operations pages: the Audit log and Runs & Traces. The automation rate-limit config lives on its own Automation limits page under Billing & Control, described at the end.
Audit log
Section titled “Audit log”The raw, date-grouped feed of everything that happened — its own page, Audit log, in the Activity nav group. It keeps the 24h · 7d · 30d · All time window and is always tenant-wide.
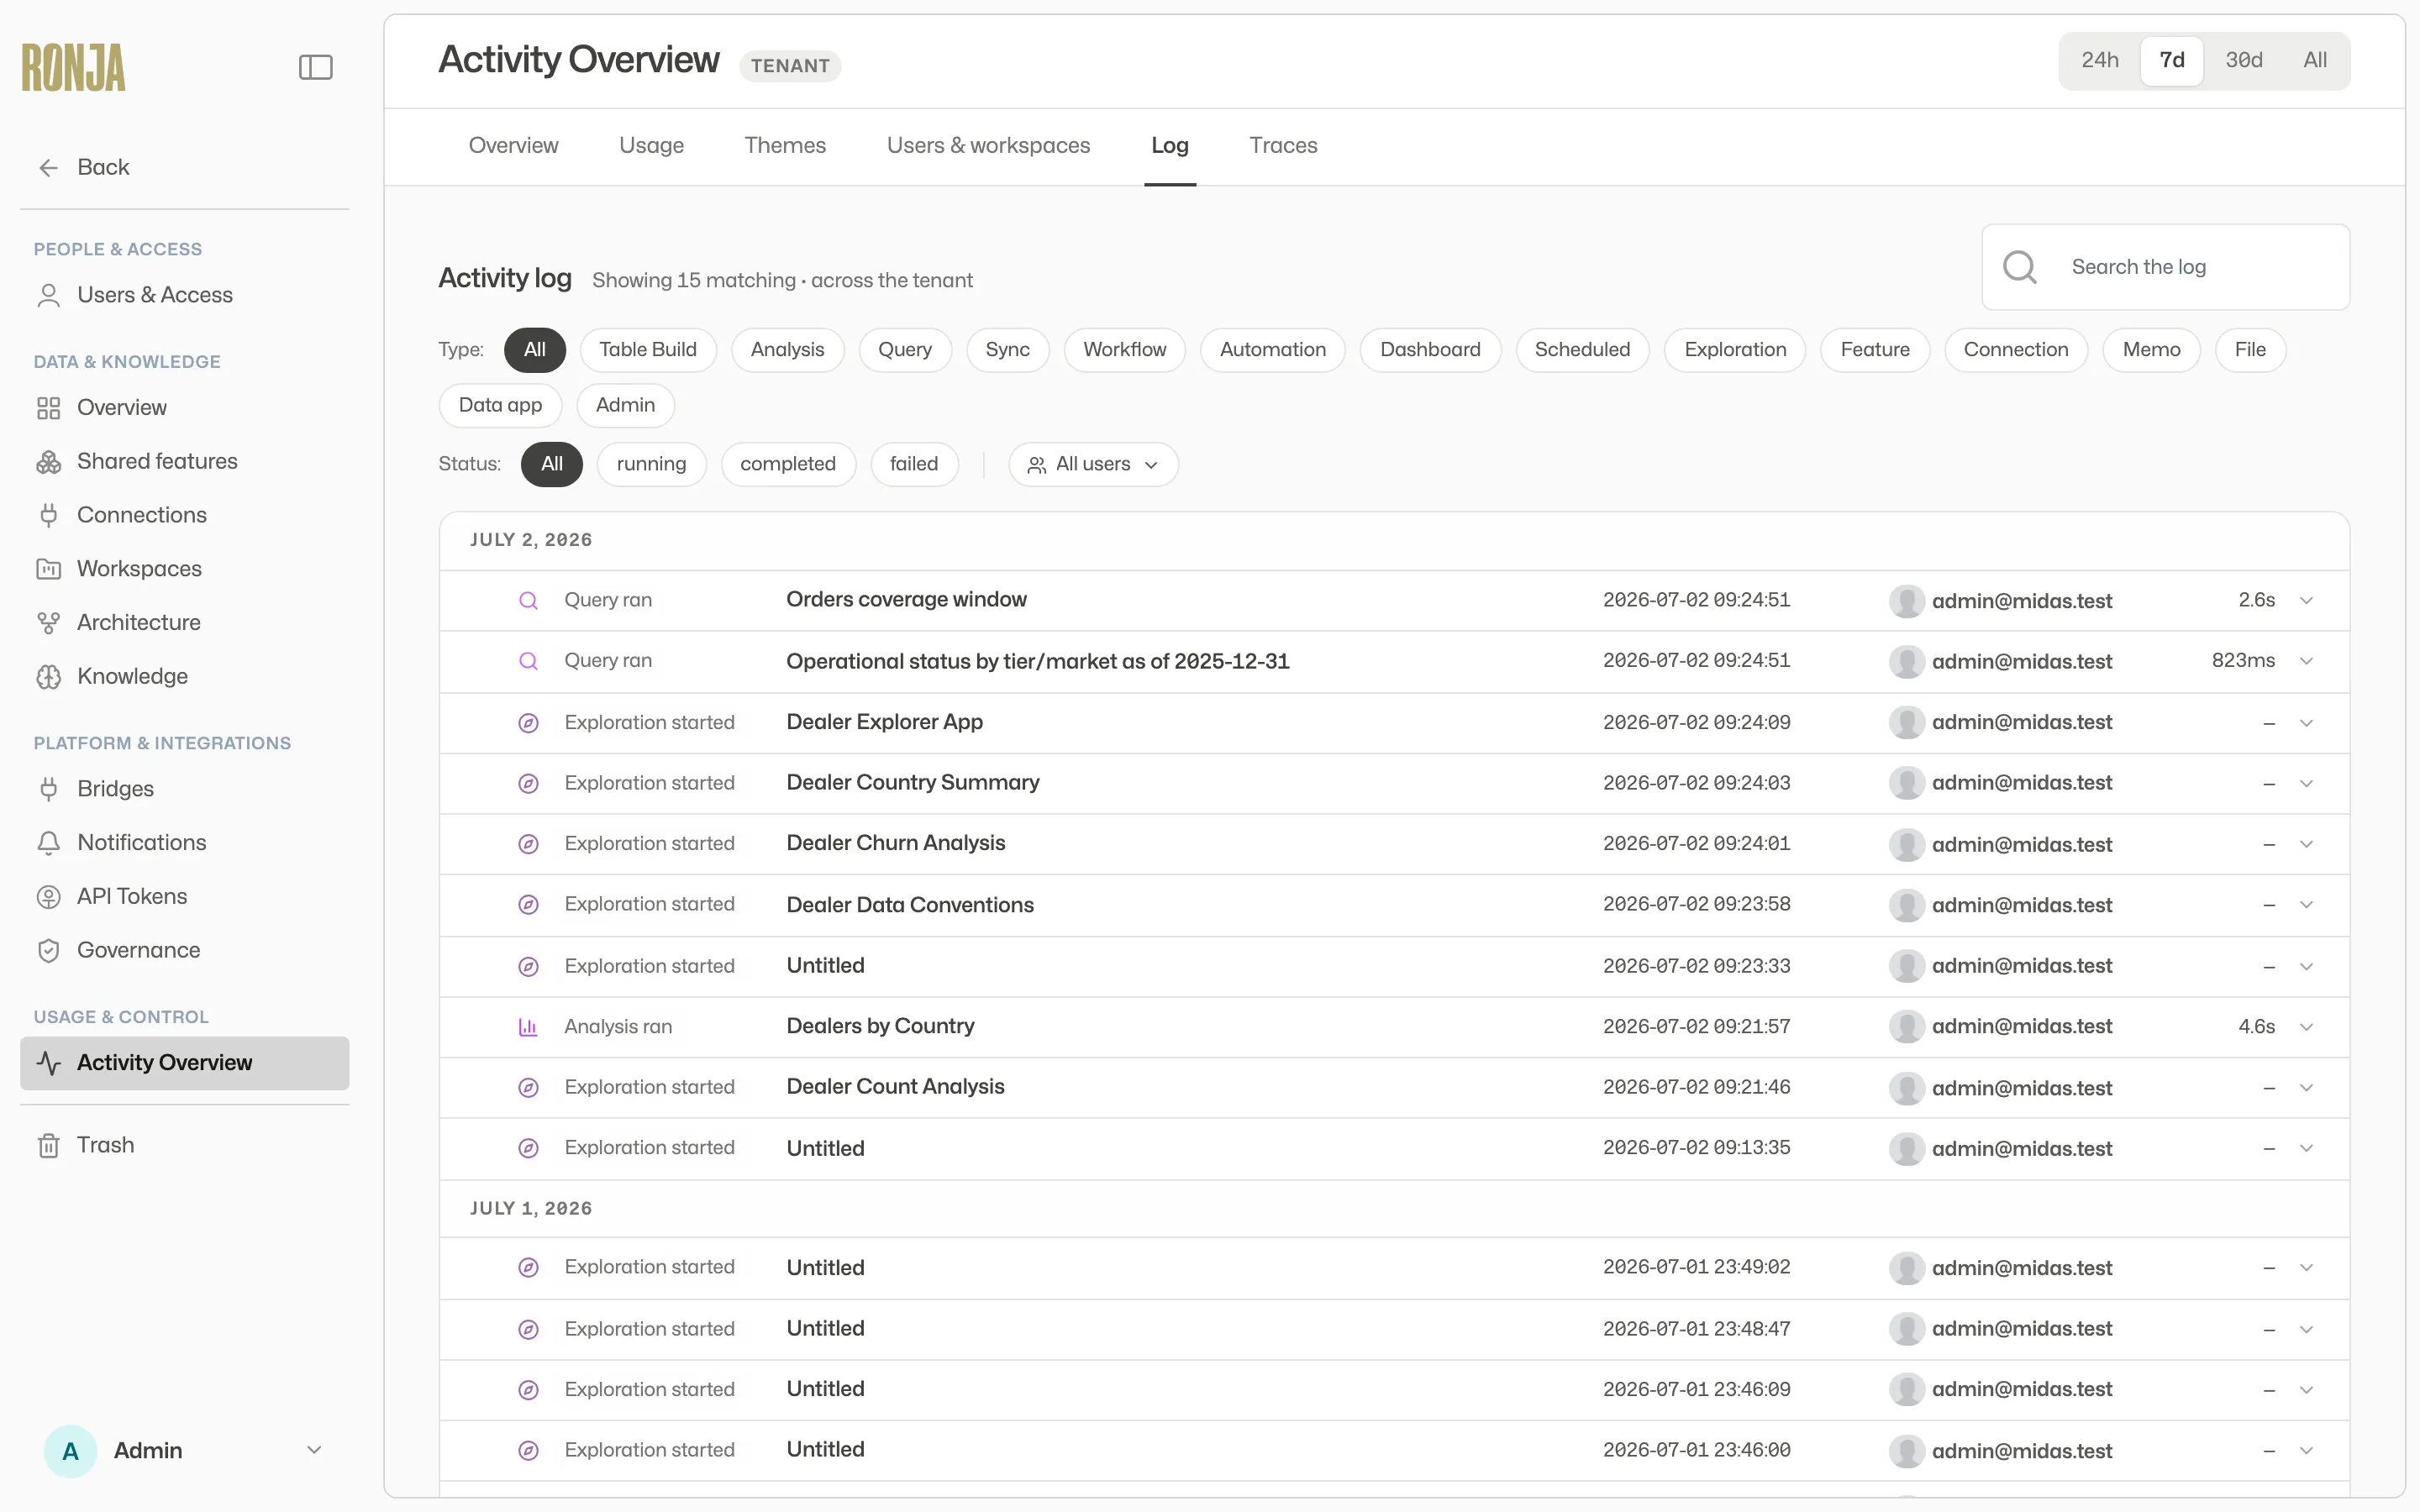 The Audit log — every logged operation, filterable by type, status, and user.
- Search the feed with the Search the log box.
- Type chips filter by operation: All · Table Build · Analysis · Query · Sync · Workflow · Automation · Scheduled · Exploration · Feature · Connection · Memo · File · App · Admin.
- Status chips: All · running · completed · failed.
- A user filter menu narrows to one person.
- Each row shows a status dot, the operation kind, its title, the user, the time, and the duration, and expands for detail. Load more pages through older activity, back to about the newest ten thousand events. When more events than that match, the list ends with a line saying how many of the newest events can be browsed.
- The Audit log names the person, not how the action arrived. That shows on most resources’ own Activity panel (for example a note’s, in the column on the right): beside the person’s name, agent (“Performed by an agent on this user’s behalf”) and via Ronja (“Performed by Ronja calling its own API on this user’s behalf”), and on its own line under the name, via PAT <name> for a change made with a personal access token. The person stays the actor either way — these labels only add the mechanism. A table’s or metric’s Activity tab shows only agent. A long name or action is shortened with “…”; hover it to see who or what it is.
- An action a station took shows the station, with a screen icon and its name, where the user would be. That covers a workflow run one of its Apps started and a query or chart the Saved Agent ran in a chat on the station. A chat on a station adds no row of its own. A station is a screen nobody signs in to, so no person is recorded for these rows, and the user filter doesn’t list stations. What a station saved through an App is shown on that App’s Activity tab; see Who did what.
When nothing matches, you’ll see “No activity matches the current filters.” — clear a filter or press No matches on the loaded pages — Load more to keep searching. Once the list has gone as far back as it can, that button is gone and the same line saying how many of the newest events can be browsed appears below the message: older matching events may still exist.
If loading takes too long, the page shows “Couldn’t load activity: The request took too long to complete.” If the request is cut off before Ronja answers, it shows “Couldn’t load activity: the server answered 504.” instead. On 30d or All, switching to 7d or 24h reads fewer events.
Runs & Traces
Section titled “Runs & Traces”The list of cross-primitive execution traces — the run-level counterpart to the Audit log, on its own page (Runs & Traces in the Activity nav group). It keeps the 24h · 7d · 30d · All time window.
- This page is always tenant-wide (“Showing N · tenant-wide”) and is not narrowed to any single access group.
- Filter the list with the Search traces… box, the Kind chips (All kinds / Automation / Manual run / Workflow / Agent / Alert), and the Health chips (Any health / No issues / Degraded / Failed).
- One row per trace: its kind, name, status badge (running, waiting, healthy, degraded, failed or skipped), an “N issues” count, and a timestamp.
- Click a row to open its full timeline at its own trace page. Load more pages through older traces.
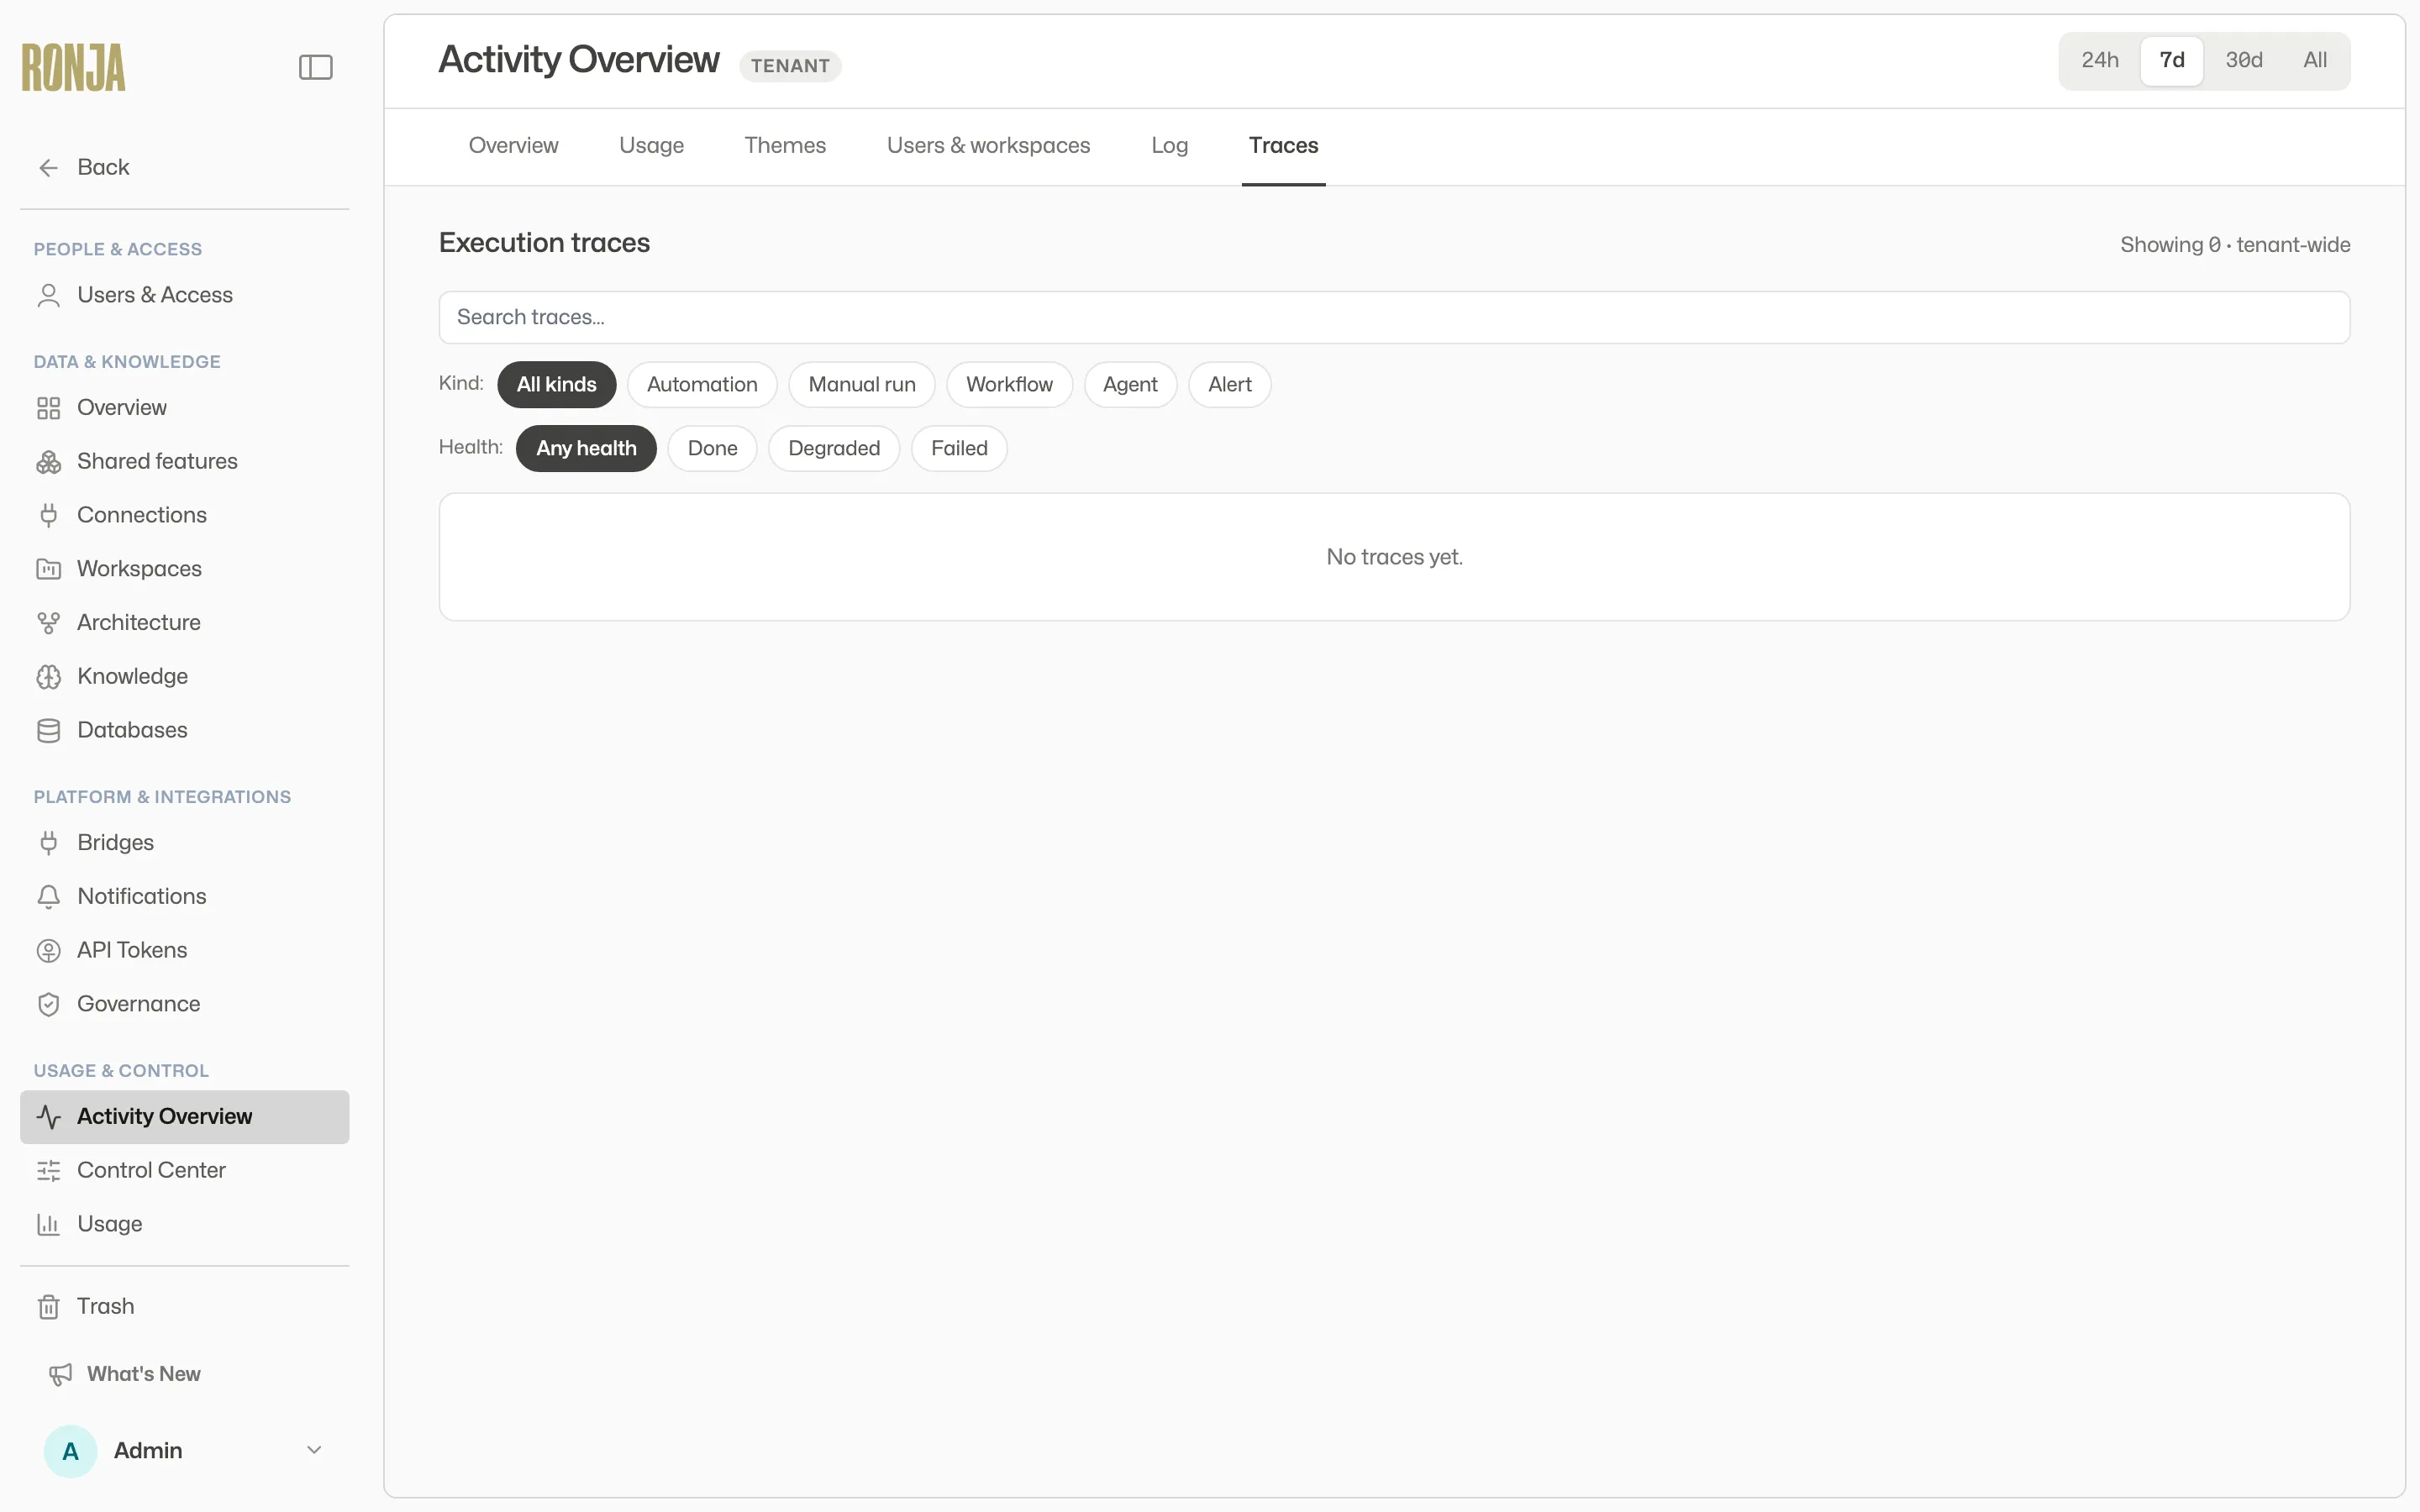 Runs & Traces — search and filter every run across the organization by kind and health.
Traces carry counts only — no cost or credits. For reading a single run end-to-end, see Monitor runs and traces.
Automation limits
Section titled “Automation limits”The org-wide rate-limit config for automations, on its own page — Automation limits in the Billing & Control nav group. It’s config rather than observability (the Activity surfaces are all read-only), so it sits with the other guardrail dials. It sets the throttle that caps how often webhook, email, and event automations can fire, and has no time window (it’s config, not counts). Per-automation limits stay in the automation editor on the Automations list.
The Rate limits section has two windows:
- Per minute — the short-burst window.
- Per day — the rolling daily window.
Each window has two fields:
- Default — the per-automation limit applied when an automation doesn’t set its own. System defaults are 60/min and 1,000/day.
- Maximum — the hardest cap an agent-set per-automation limit is allowed to reach. This is your cost guardrail: Ronja can raise an automation’s own limit up to this ceiling, never past it.
Both windows are enforced: a burst under the per-minute limit passes; go over either window and the run is dropped. Enter positive whole numbers, with each Maximum at least as high as its Default, then click Save limits. Each field shows its system default. Unsaved changes tells you the form has edits; Saved confirms the update. If loading or saving fails, the page explains the failure and preserves your entered values.
See also
Section titled “See also”- Usage & billing — the credit side: what your team’s activity cost.
- Monitor activity and usage — the Activity page: people, topics, apps and data.
- Monitor runs and traces — reading a single run end to end.