
Usage & billing
The Usage page is where you see, in detail, what your organization’s credits went toward this cycle — “from the source that triggered the work down to the model and compute behind it.” Open it from the admin sidebar under Billing & Control. (A note on names: the sidebar label is Usage and the page title is Usage & billing — buying credits lives on a separate Billing page, covered at the end.)
Everything on this page is measured in credits, and always as billed figures — the numbers that actually count against your organization. There are no raw vendor costs, margins, or multipliers anywhere here; a flagged admin sees exactly the same figures.
Under the header, three tabs split the page:
- Overview — the whole picture: the Cost flow and the Cost explorer. This is where the page opens.
- AI — just the model calls. See The AI tab.
- Compute — the processing behind your data, down to which tables and connections cost you credits. See The Compute tab.
The AI and Compute tabs show their totals for the cycle beside their names.
The two KPI tiles
Section titled “The two KPI tiles”The header shows two tiles side by side:
- Usage this cycle — the total credits used so far this cycle, and a delta reading “% vs last cycle · day N of M”. This is spend; it is not a limit. If the way your plan prices processing, or your plan’s currency, changed during this cycle or the last one, the delta reads Not comparable with last cycle instead: the two cycles weren’t billed the same way, so a percentage would show the change of plan, not a change in usage. Under the total, a meter and three figures split it: AI (the model calls), Compute (queries, table builds and syncs, workflow runs and automation runs) and Billed hours (professional services). The three add up to the total, and AI and Compute match the figures beside their tab names.
- Credits remaining — your organization’s wallet balance. When the wallet is funded, this shows a number with a colored meter and, if a refill is scheduled, a “+N on date” chip. A refill lands within about an hour of a new billing cycle starting; until it does, the chip reads “+N pending since date”, the day the cycle started, and the number doesn’t include those credits yet. If credit enforcement is off for your organization, it reads Not activated with “Exempt from credit enforcement” instead. A depleted wallet shows red.
- Monthly budget — in place of Credits remaining if your organization is on a monthly budget: the budget, for example “1,000 credits”, with a meter and “62% used · resets 3 Nov”. If Ronja has set no budget for your organization, it reads No monthly budget with “Nothing stops when usage grows.”
The subtitle sums up the page: “What’s driving your usage this cycle, end-to-end — from the source that triggered the work down to the model and compute behind it. Metered in credits.” If your plan is priced in euros, it ends with your plan’s price of one credit instead, for example “Metered in credits · 1 credit = €1.00.”
Stepping through cycles
Section titled “Stepping through cycles”Ronja bills over your organization’s own anniversary period, not the calendar month. Use the ‹ › cycle stepper next to the header to move to earlier billing cycles; the label and date range come from Ronja. You can’t step into the future.
The cycle you step to stays put when you switch tabs, and it is part of the page’s link — copy the address to share a past cycle, and whoever opens it lands on the same one.
If a cycle fails to load, the page says “Couldn’t load usage for this cycle.” with a Retry button — and, on a past cycle, Back to current cycle.
Cost flow — where credits go
Section titled “Cost flow — where credits go”On the Overview tab, the Cost flow card is the heart of the page. Its hint reads “Every credit, from the source that triggered it to the model & compute behind it,” and it has two views you switch between with a Flow | Trend toggle:
- Flow is a Sankey diagram: credits flow from sources on the left to types on the right.
- Trend is a stacked daily area chart of the same families over the cycle.
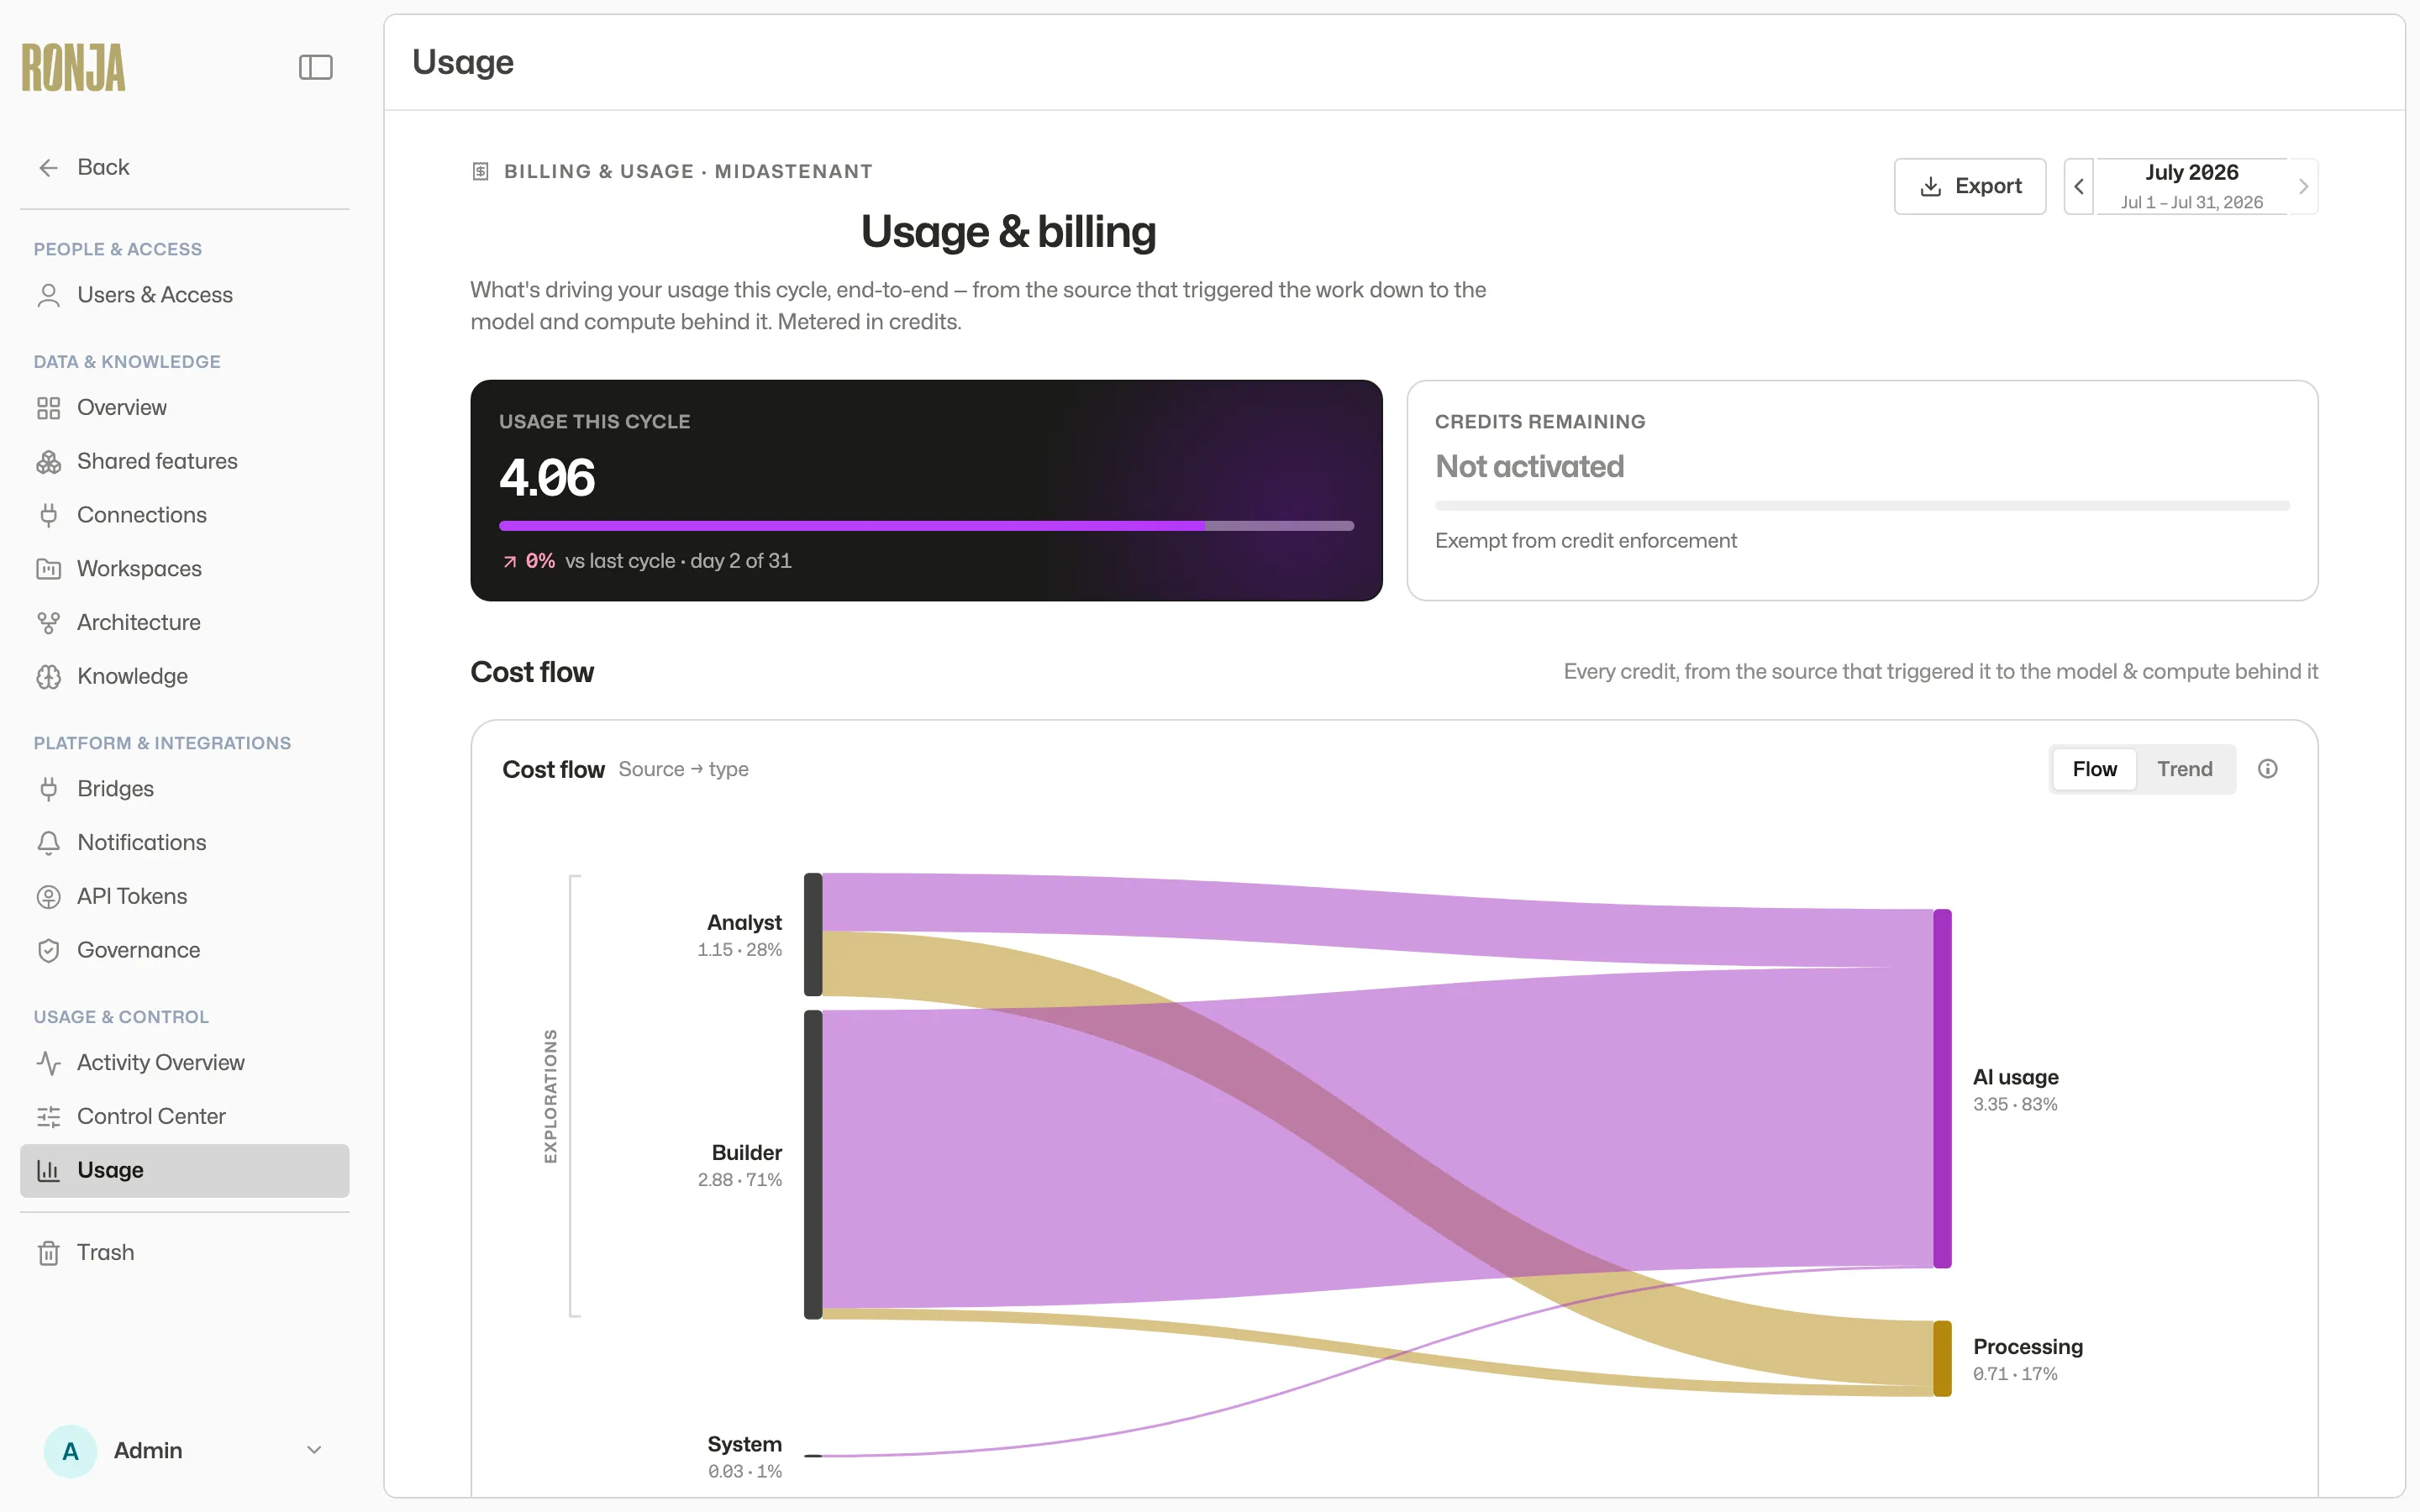 Cost flow, Flow view: each source on the left feeds into AI usage, Compute, or Billed hours on the right.
Sources — what kicked off the work:
- Analyst — asking Ronja questions and exploring data in chat (the Standard mode).
- Builder — Build mode work, creating and editing workflows, notes, and apps, plus Deep analysis chats, which run on the same models and effort as Build.
- Automations — scheduled and triggered runs.
- Apps — interactive apps your team opens and uses day to day.
- Data platform — the data-processing layer itself (queries, table builds).
- System — background work Ronja does on its own.
Types — the work behind each credit:
- AI usage — the model calls behind conversations and agent work.
- Compute — queries, table builds and syncs, workflow runs and automation runs: the same credits as the Compute tab.
- Billed hours — hands-on time billed by the Ronja team for professional services.
If a cycle has no measurable usage, the card shows “No measurable usage this cycle” — usage appears as your team runs explorations, automations, and data jobs.
The cost glossary
Section titled “The cost glossary”Every source and type has a plain-language definition. Click the ⓘ button beside Flow / Trend on the Cost flow card to open the glossary popover — for example, Analyst is “Asking Ronja questions and exploring your data in chat,” and Billed hours is “Hands-on time billed by the Ronja team for professional services.” Reach for it whenever a label isn’t self-explanatory.
The Cost explorer
Section titled “The Cost explorer”Below Cost flow, the Cost explorer breaks the same credits into a sortable table. Change the grouping to answer different questions:
- Source — which lane (Analyst, Builder, Automations, …) is driving spend, with a composition breakdown. (This is the default grouping.)
- User — spend per person, with their session count and a “% builder” sub-figure so you can see who’s doing the credit-intensive build work.
- Model — spend by model and vendor.
- Mode — Analyst mode (Standard) vs Builder mode (Build and Deep analysis), with session counts.
- Recent chats — the latest chats, each with owner, when, and its mix.
- Billed hours — professional-services entries: date, consultant, hours, and note.
Sort by the Usage column to find the biggest line. All figures are billed credits, shown to two decimals.
The Cost explorer opens on Source, which shows straight away. Every other grouping loads the first time you pick it in a cycle, so you may see a brief “Loading…” row; switching back to it is instant while you stay on this cycle. If a grouping fails to load, it shows an error row with a Retry button. On Mode, the credits show at once and the session counts fill in when they arrive. The AI tab’s By model table loads the same way.
The AI tab
Section titled “The AI tab”The AI tab shows only AI usage — “Model calls behind conversations, agents and background work.”
- Three tiles split it by kind, each with its share of AI: Conversation (chat turns with Ronja), Agent (tool-calling agents and loops) and Direct calls (workflows, learning and background work).
- Daily AI usage is a chart of each day of the cycle, stacked by those three kinds. Hover a day to see its figures.
- By model lists each model with its vendor, the tokens and calls it used, and its credits, most expensive first.
- By source shows how much AI usage each source (Analyst, Builder, Automations, …) drove. It counts only the AI part of each source, so a source that mostly builds tables shows a short bar here.
The Compute tab — which tables cost you credits, and why
Section titled “The Compute tab — which tables cost you credits, and why”The Compute tab answers the question the Cost flow can’t: which of your tables and connections your processing credits went to, and why they were built. Open it from the tab strip under the header.
Everything on it is billed credits.
The four tiles split your processing credits by kind of work, each with its share:
- Table builds & syncs — building your tables and syncing your connections. This is the one broken down below.
- Queries — charts and questions in chat, apps and workflows.
- Workflow runs — Python workflows.
- Automation runs — the fee charged once per automation run.
Tables & connections lists what your table builds and syncs cost this cycle, most expensive first:
- Table or connection — the table’s name and kind, or the connection’s name with a Connector sync tag. A table’s drafts and earlier versions count toward the table itself. A table or connection in the trash shows an In trash tag and has no link until you restore it. A connection that has since been deleted shows as Removed connection. File uploads is one row for processing the files you upload. A table or connection that lives in another member’s private feature is listed too — your organization was billed for it — and carries a Private tag. Ronja doesn’t say whose it is.
- Builds — how many times Ronja built the table this cycle; for a connection, how many times it synced (“syncs”); for File uploads, how many files were processed (“uploads”).
- Per build — the row’s credits divided by its builds.
- Last built — how long ago it last ran, including builds of its drafts.
- Credits — what it cost this cycle.
Click a row to see why it cost what it did. The bar shows the share of the row’s credits by reason:
- From chat — Ronja built it during a conversation.
- From an automation — an automation run built it.
- Manual rebuild — someone rebuilt or synced it by hand.
- Published a change — a change to the table was published.
- An input changed — a table it reads from got new data, so it rebuilt.
- Connector sync — a connection synced.
- File upload — an uploaded file was processed.
- Retry after failure — Ronja retried a build that failed.
- Not recorded — Ronja doesn’t know. Build reasons are recorded since September 2026, so earlier builds all show as Not recorded.
Next to the bar, the row’s facts: its builds (for a connection, its Syncs) and how many failed (and, for a table, how many ran on a draft), its size and row count now, and its share of all table builds & syncs. A row in someone else’s private feature says so here: “In another member’s private feature. It’s listed here because it cost credits this cycle.” Open table → goes to the table, and See build times on the Data map → opens the Data map with the Builds lens on, showing that table’s pipeline, which is where build times live. For a connection, Open connection → goes to the connection.
Below the list:
- N more tables and connections — everything past the first 25 rows, added together, along with any build credits Ronja couldn’t tie to a row. When nothing is past the first 25, that leftover row reads Other table builds and syncs. With it, the list sums exactly to the Table builds & syncs total — including on the cycle you’re in now, where a build can land while the page is loading.
- Removed tables and discarded drafts — builds of tables that no longer exist, including drafts that were thrown away. They were still billed, so they stay on the list.
A table’s Builds show “—” where Ronja doesn’t count them: for tables fed by uploads, connectors or incoming data, whose credits come from processing that data rather than from a build Ronja logs, and for any table in a cycle more than a year back — Ronja keeps a year of build history, while the credits themselves are kept for good.
On a plan that prices processing per GB and per hour
Section titled “On a plan that prices processing per GB and per hour”Some plans price processing by the data it handles and the time it runs, rather than by what the compute cost: table builds and queries are charged per GB of data, and workflow runs per hour of runtime, with a short minimum per run. The tabs work the same way, with three differences you’ll notice:
- A table’s credits in Tables & connections are its builds’ share of the data processed this cycle.
- Connections and File uploads show 0 credits. The data they bring in is charged once, when the table it feeds is built, so it appears on that table’s row instead.
- Whenever this cycle or the last one was billed partly or wholly on the other pricing method, or in another currency, Usage this cycle reads Not comparable with last cycle rather than a percentage.
Buying credits (Super Admin)
Section titled “Buying credits (Super Admin)”Topping up the wallet happens on the separate Billing page (sidebar → Billing & Control → Billing), which only the Super Admin can open. An organization on a monthly budget doesn’t buy credits: its Billing page shows a Monthly budget card, with this period’s use and a link to Control Center › Rules, in place of the balance, Buy credits and the purchase history. How you buy depends on how your organization pays: by invoice, or by card.
In an organization billed by invoice
Section titled “In an organization billed by invoice”Credit purchases are invoiced, not charged to a card.
- Open Billing. The Total available credits card shows the wallet balance, with “N added · N used” beneath it. (If your organization has never been funded and enforcement is off, it reads “Not enrolled.”)
- In Buy credits, enter a Credit amount. A live Cost preview and a per-credit rate appear as you type.
- Click Buy credits, then Confirm in the Confirm credit purchase modal — it restates the amount in your plan’s currency and the credit count. If your plan’s currency changed after this billing cycle began, the modal also names the currency this cycle’s invoice is in and says the invoice will show the amount converted at the European Central Bank (ECB) rate.
Invoiced credits top up the wallet immediately (allow up to about 20 seconds to take effect); “the cost is added as a line on your next invoice — your card is not charged.” The Credit extensions table records your wallet top-ups, not only purchases: card and invoice purchases, your monthly subscription refills, and trial credits. Each row shows the date, credits, cost, a Method column that distinguishes them (Card, Invoice, Subscription refill, or Trial credits), who bought it (for purchases), and a Receipt column, which shows “—” except on card purchases.
In an organization that pays by card
Section titled “In an organization that pays by card”Credits are charged to a saved card rather than added to an invoice.
- Open Billing. Until a card is saved, the Buy credits card reads “Set up a card to buy credits. You won’t be charged until you buy.” Click Set up a card and enter the card on the secure payment page that opens — nothing is charged. Back on Billing, the card appears on a Payment method card within a few seconds; click Update there to replace it later.
- In Buy credits, enter a Credit amount. A live Cost preview appears as you type.
- Click Buy credits. Your saved card is charged straight away — there is no confirmation step — and the credits appear in the wallet a few seconds after the payment goes through.
To top up automatically, switch Auto-refill on in the Payment method card, fill in Refill when below and Refill amount, and click Save: whenever the balance drops below that many credits, Ronja charges your saved card for the refill amount. If the card is declined, auto-refill pauses and the card says so — “Your card was declined — auto-refill is paused.” Click Update card to fix the card, then Re-enable; auto-refill stays paused until you do.
Your purchase history is the Receipts table, with the same columns as the invoice table above; each card purchase has a Receipt link. Manage billing, at the top of the Buy credits card, opens your billing account with the payment provider, where you can see past payments and change the saved card.
See also
Section titled “See also”- Credits and AI spend — what credits are and what happens at depletion.
- Govern AI spend — the overview of the levers that shape spend.
- Control Center — the deep dive on budgets, allocations, build mode and spend steps.
- Monitor activity and usage — the usage side: who uses Ronja and on what, without credit figures.