
BI & Analytics
How much of your week goes to dashboards nobody uses?
Agents handle the execution. You handle quality and strategy. Full traceability, real code, no hallucinations.
Get started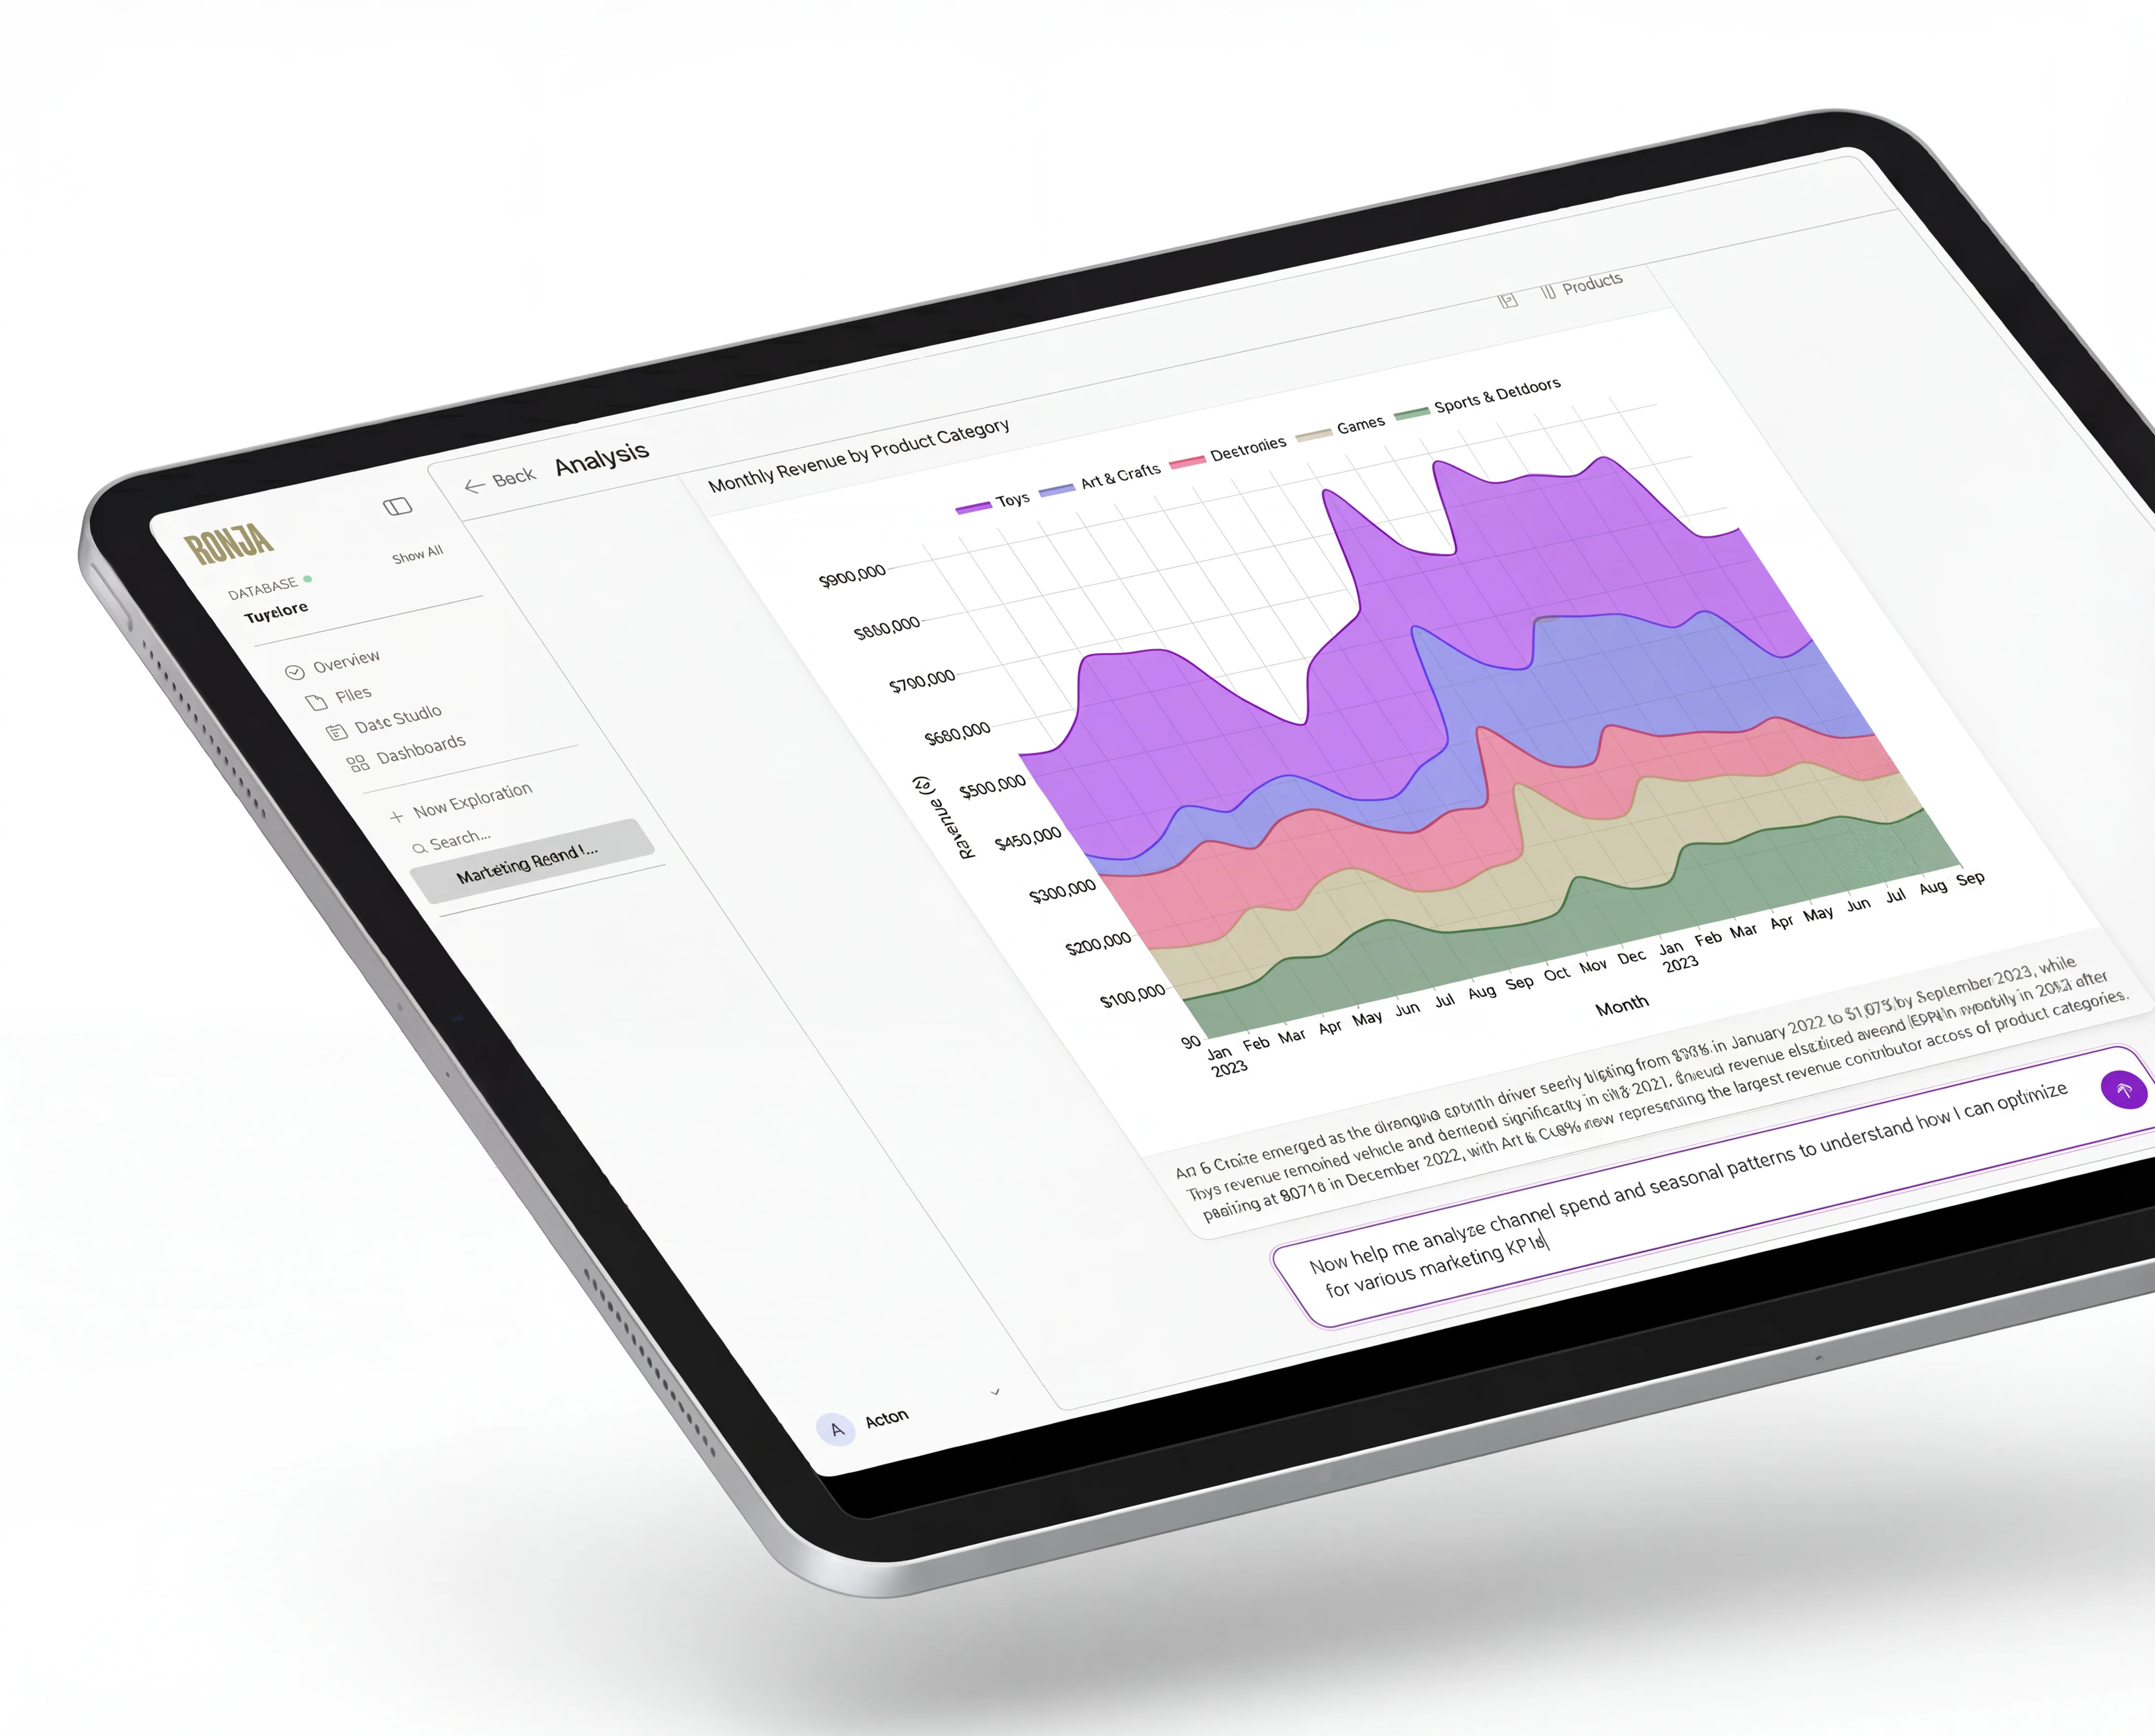


Sound familiar?
BI and analytics teams are expected to empower the org with data, but most of the time goes to dashboard requests and metric definitions nobody agrees on.
Dashboard waste
You’ve built hundreds of dashboards. Most are never opened. But every stakeholder still wants a new one.
Ad-hoc overload
Your team spends more time answering one-off questions than building anything strategic. The backlog never shrinks.
Metric definition chaos
Marketing’s ‘conversion rate’ isn’t the same as sales’. Nobody agrees on the numbers, and every meeting starts with ‘where did this come from?’
Lost in translation
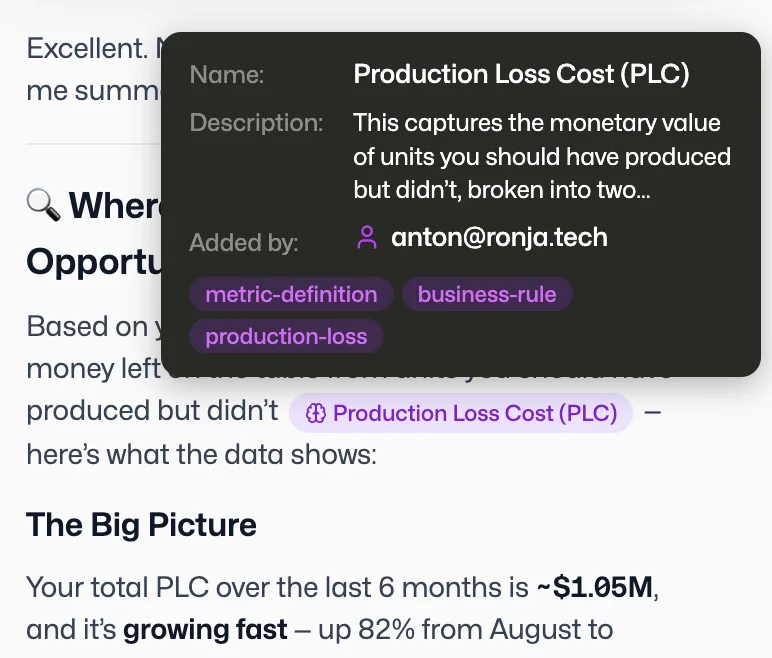
Stakeholders describe what they want in business terms. You translate it to SQL. Half the time, the result isn’t what they meant. Ronja detects where teams define terms differently and surfaces the evidence, so your data team can resolve it before the board meeting does.
From translating to analyzing
Ronja’s AI agents handle dashboard creation, metric calculation, and report delivery. Your team shifts from executing requests to ensuring data quality and strategic insight.
- Business users get dashboards and answers directly, no tickets needed
- Endorsed definitions ensure everyone uses the same metric
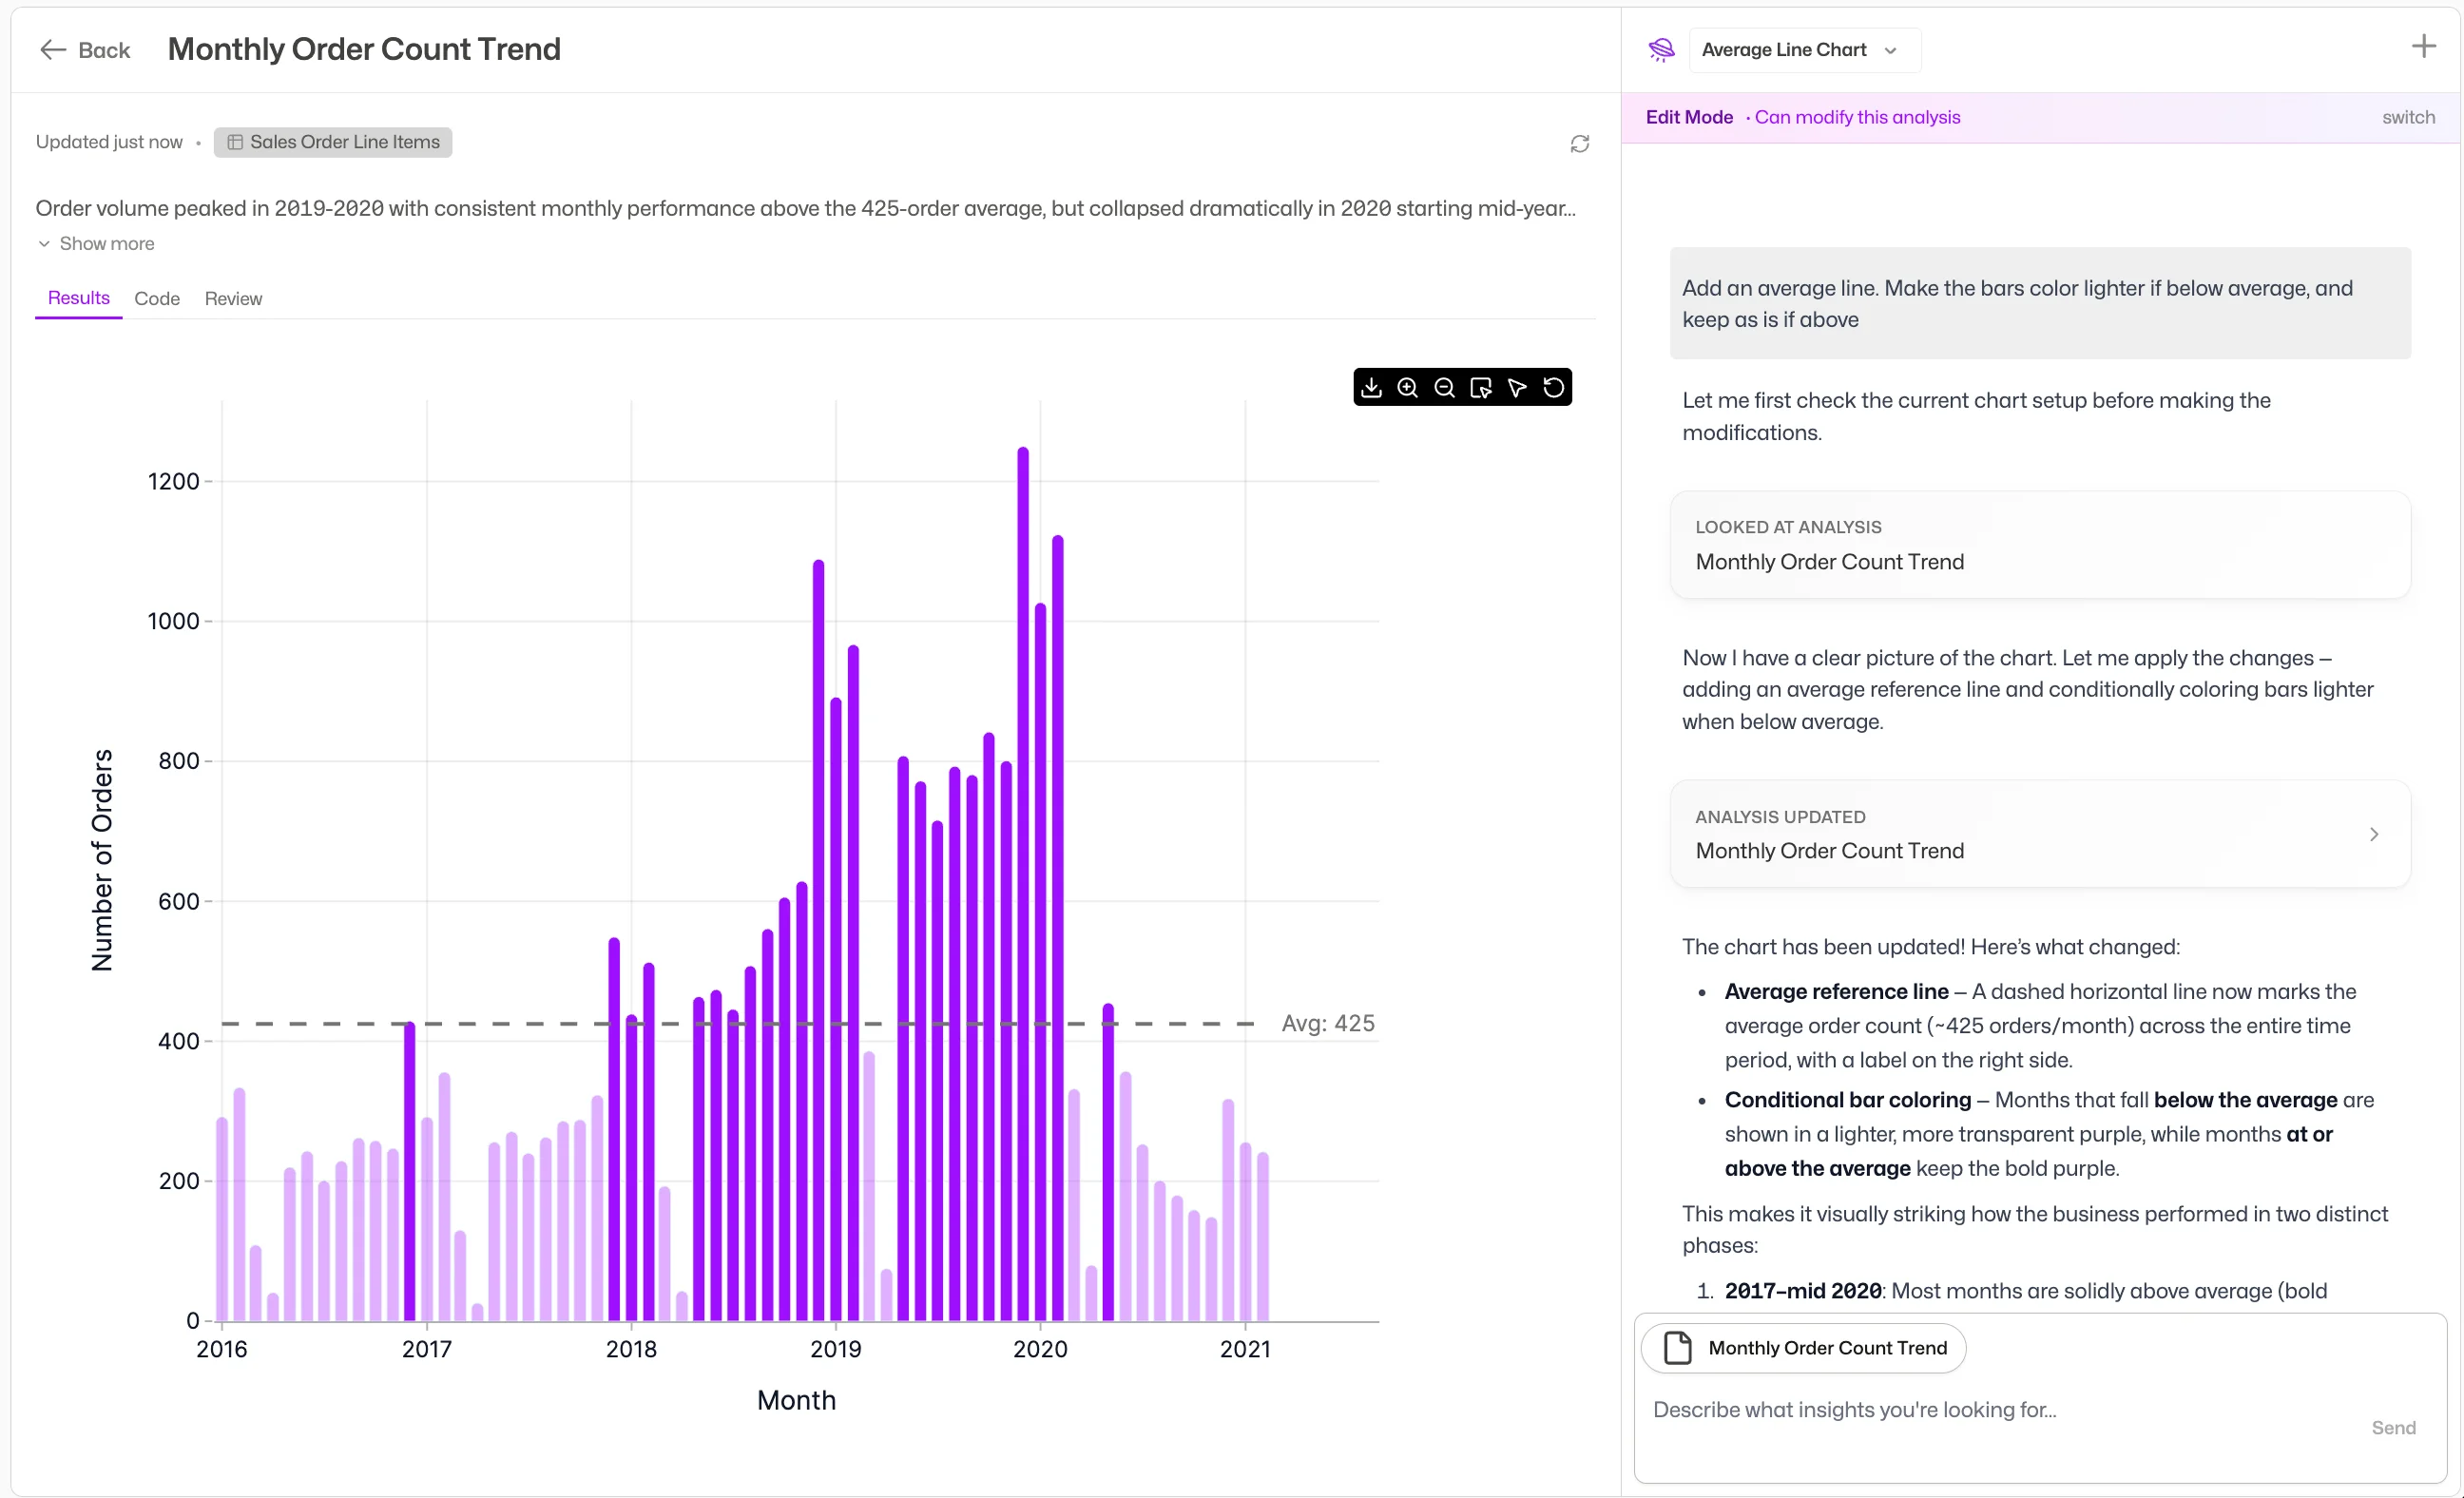
- Agents build visualizations from plain language questions
- Your team governs quality, not the request queue
- Full data traceability. See exactly where every number comes from
How Ronja works
Every source connected. Automatically.
Salesforce, HubSpot, your ERP, billing tools, support platforms. Ronja connects to 100+ sources and keeps the data flowing. One unified view, always up to date.
Ask the questions that actually matter.
Ronja joins data across all your systems automatically. Ask anything, in plain language, and get answers traced to source.
Your data has structure. Endorsed definitions give it meaning.
Endorsed definitions store your metric calculations, dimension hierarchies, and business rules. Define it once. Agents apply the right context to every question. No more conflicting metric definitions. Define them once, agents enforce them everywhere.
What Ronja does for BI & analytics teams
Self-Serve Dashboards
Business users create dashboards by asking questions in plain language. No SQL, no tickets, no waiting. Your team reviews and endorses the definitions.
Metric Governance
One endorsed definition for every metric. Agents enforce consistency across all dashboards, reports, and answers.
Automated Reporting
Agents deliver reports to email, Slack, and dashboards on schedule. Always fresh, always traceable to source.
Strategic Analysis
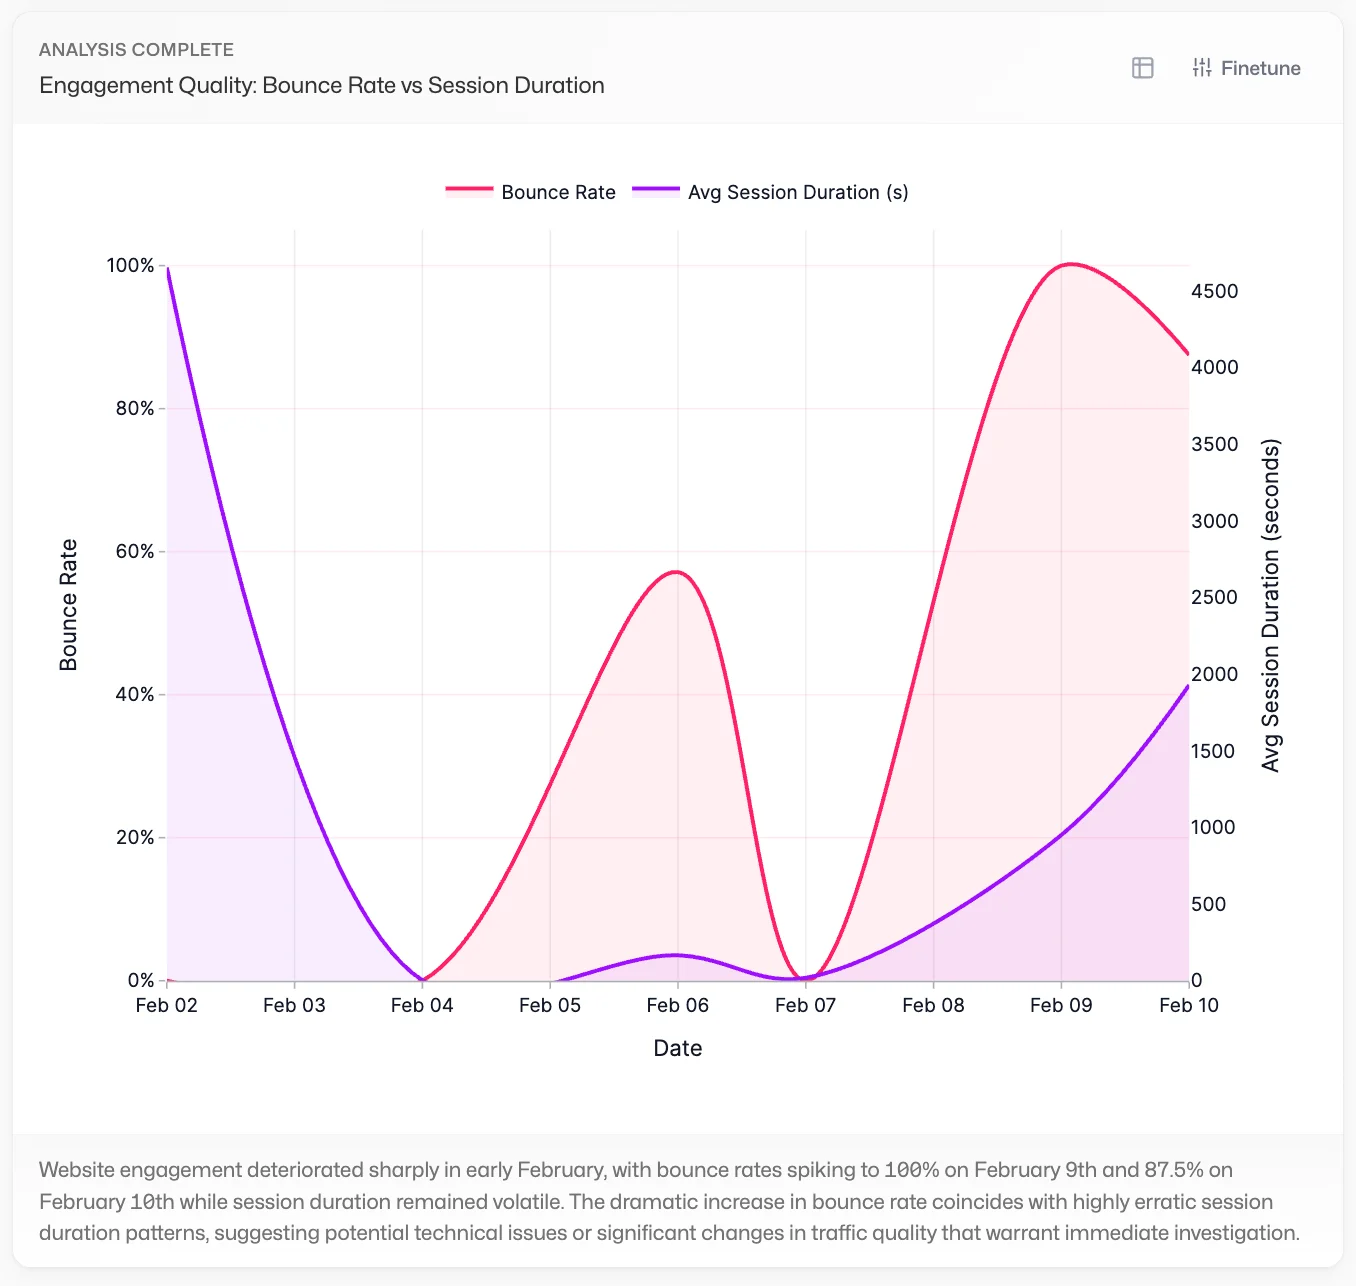
With execution handled by agents, your team focuses on what matters: finding insights, spotting trends, and advising the business.
Just ask
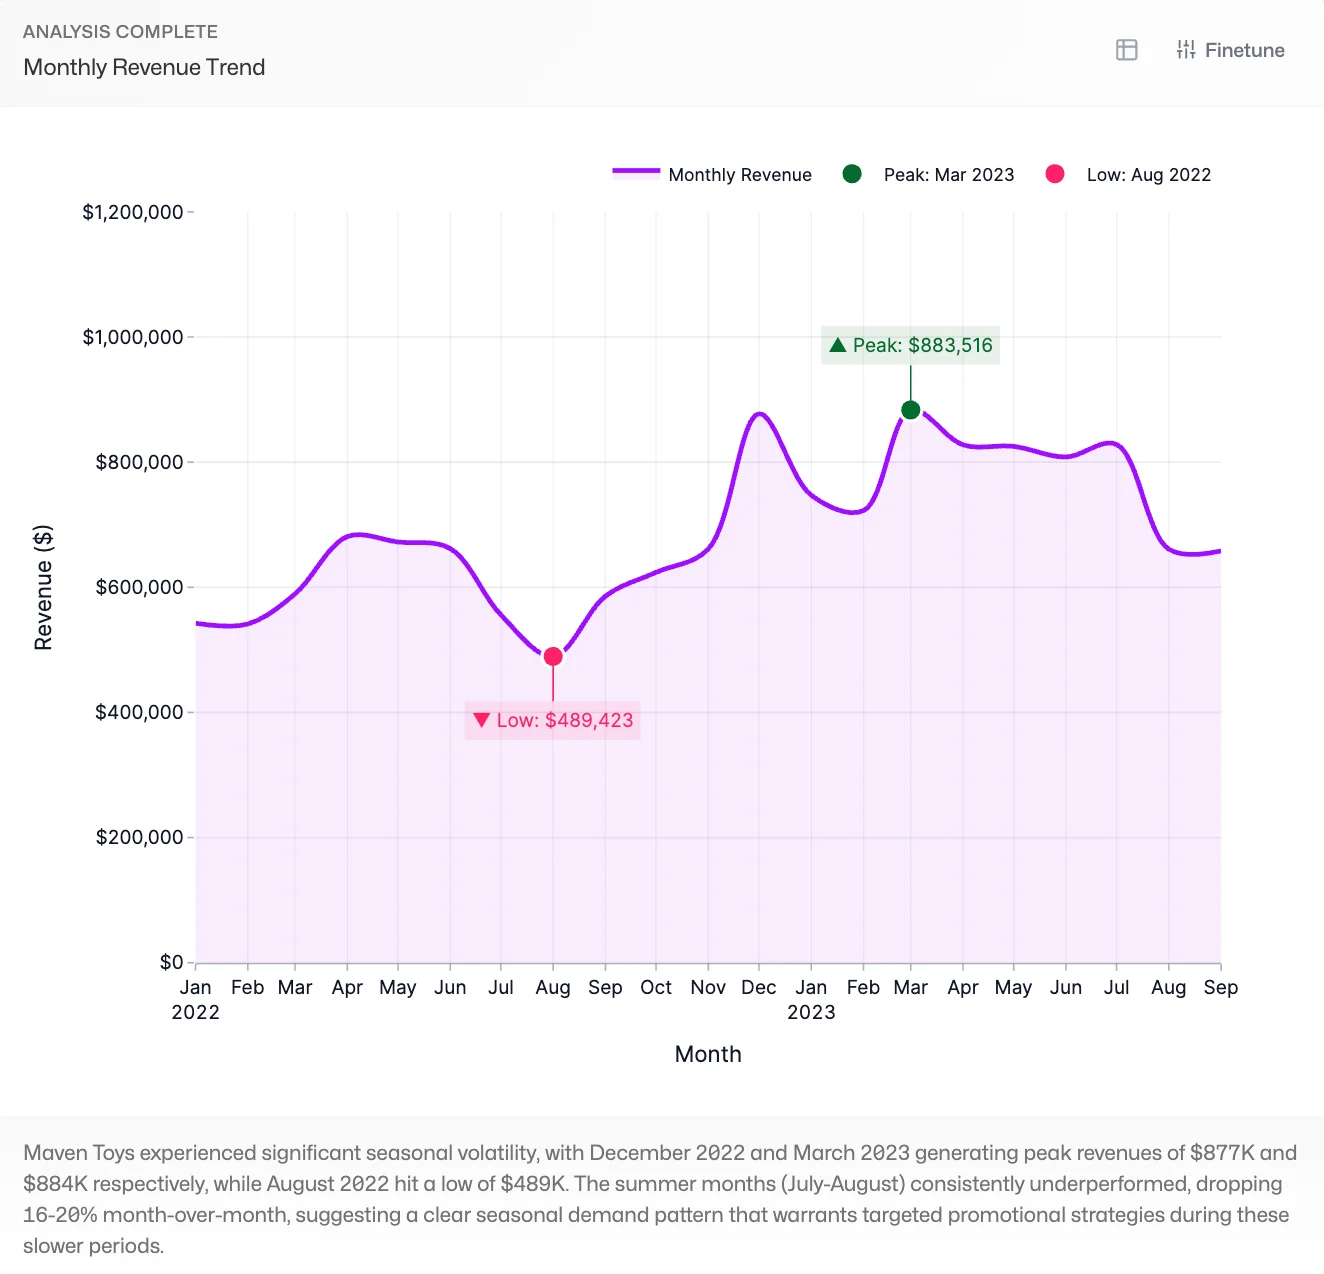
The questions everyone asks. Answered instantly, traced to source.
Ask in plain language. Get answers traced to source. No analysts, no dashboards, no waiting.
Every answer in Ronja is traceable to source. No hallucinations, no black boxes. Real code, auditable and reproducible.
How Ronja compares
Not another BI tool to manage
| Ronja | BI tools & analysts | |
|---|---|---|
| Time to first insight | Minutes | Weeks of dashboard building |
| Who does the work | Agents handle routine work. Your team governs. | BI analysts and engineers |
| When sources change | Agents flag changes and propose fixes. Your team approves. | Dashboards break |
| Reporting | Always up to date | Static, outdated by the time it’s shared |
| Accuracy | Traceable to source | Depends on who built the dashboard |