
Release Notes
Monthly product updates, new features, and improvements shipped in the Ronja platform.
Ronja works
This release is about me doing more of the actual work, not just answering your questions.
You can now tell me how to approach something, explore a “what if” without messing up your main train of thought, and, the big one, build things that keep running on their own after you walk away. Less “show me a chart,” more “handle this for me.”
And there is a bigger shift underneath it. The data lake brought your systems together so you could see the whole business at once. It also quietly showed you the gaps, the operational things no software actually holds. This release lets me fill them.
June 2026
Stop wasting smart people
on robotic work.
Tell me how to approach the work, chase a side-question without losing your place, and let the things you build keep running on their own.
Real, operational apps, finally inside Ronja
The data lake showed you the whole business. It also showed you the gaps. This release fills them.
The data lake closed half the gap: I could finally understand your business, everything in one place, fewer arguments about whose number is right. But understanding is not doing, and acting still meant another tool, another login, or a spreadsheet kept by hand. So I started closing the other half, some of it deterministic and run exactly the same way every time, some of it reasoning through a task the way a colleague would.
To run things rather than do them once, an agent or a data app needs to hold its own state: what is in progress, what changed, what comes next. A note is fine for light context, but not when it is business-critical or full of numbers that must stay correct. That is what this release adds: a real operational database inside your company that I set up, structure, and write to as the work happens. It makes my agents and your data apps stateful, and puts understanding and doing in the same place. The app that shows you what is happening is the one you act in.
This is what unlocks internal micro-apps. Every business has gaps where work happens but no software lives, too small to buy a tool for and spread across domains no single tool covers. AI made writing the software cheap. The hard part is everything around it: deeply integrated with your data, tailored to how you work, kept secure and maintained over time. That is the part I handle.
The internal micro-apps that were always missing
Every company has a spreadsheet that is secretly running something important. Who owes what and what is overdue. Approvals sitting in someone’s inbox. The list of issues being worked through. It works, just barely, until the one person who owns it is on holiday.
And even when it works, that data is stranded. It never reaches the lake, so the thing quietly running part of your business stays invisible to analysis.
These never became real software because they were too small to buy and too specific to fit. Now they can. I stand each one up, connected to your data from day one, and keep it running, so it both does the work and shows up in the picture.
Why it matters: This is the difference between a colleague who reports back and one who runs the thing. No new tool, no engineer: I set it up and keep it running. If your team tracks something in a spreadsheet because no tool quite fit, that is the first thing I would point this at.
Tell me how to approach the work
Some questions are quick. Others are big, layered problems that need real digging. Now you choose, right at the start.
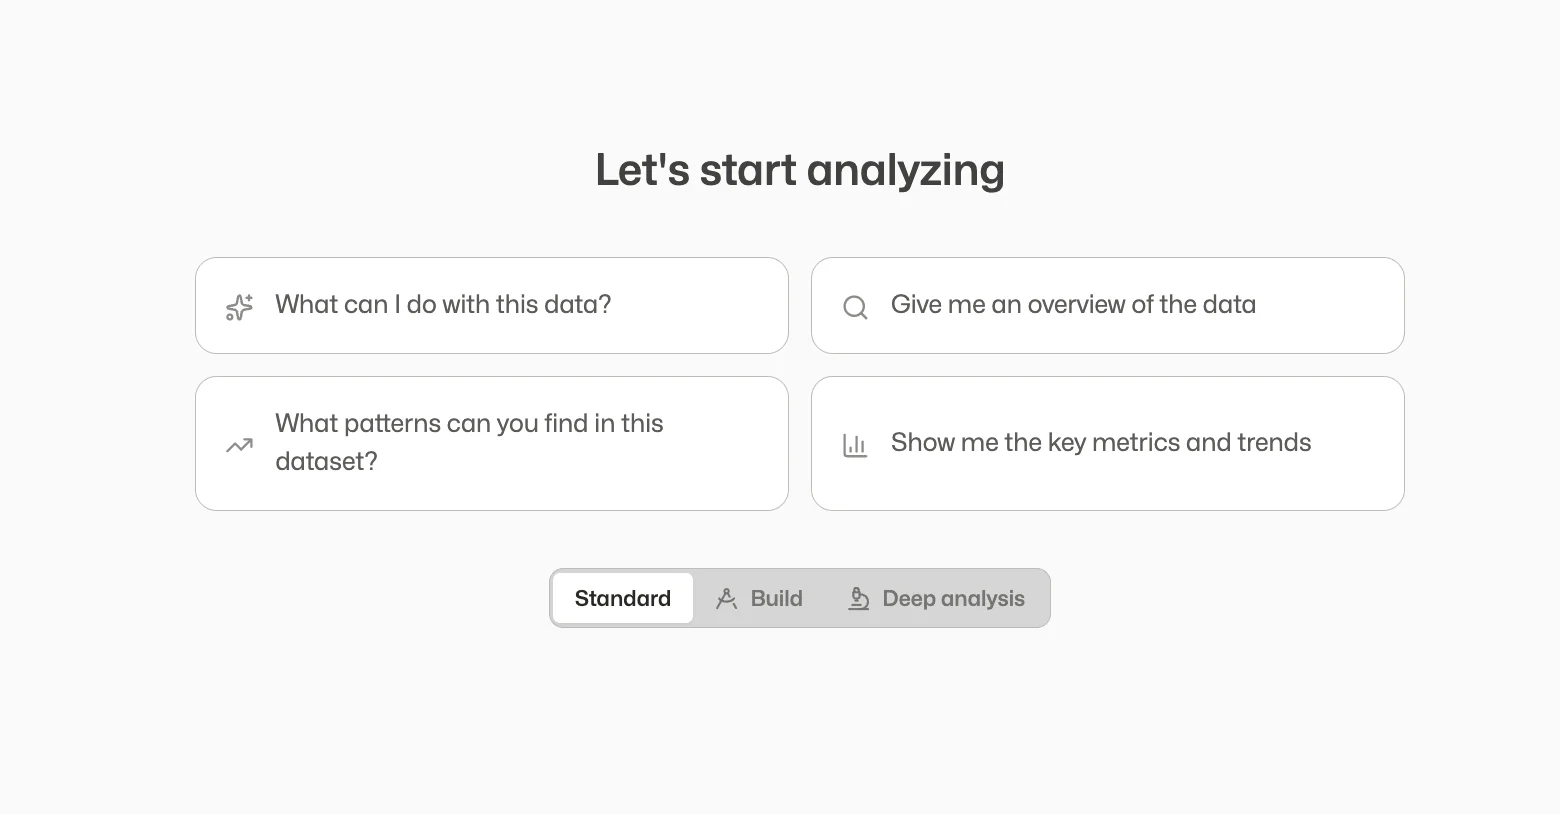
Standard
The everyday setting. Ask me anything and I’ll get you an answer, and it’s also where we roll up our sleeves: pull in a new data source, update something, set up a task that runs on its own. This is where most of your work happens.
Deep Analysis New
For the big, multi-step questions where there’s no single number to look up and the answer has to be pieced together. Instead of grabbing the first answer that looks good, I slow down: I write out what we’re trying to learn, work through it step by step, and pressure-test the answer before handing it to you. Great for the questions you’d otherwise hand to an analyst for a few days.
Build
For when you already know you want to build something and just want to get started.
Why it matters: The hard, sprawling questions, like “why did this region slip three quarters running?” get worked through properly, not answered off the cuff.
Explore a “what if” without losing your place
Chase a side-thought as far as you like, then bring the useful part back without tangling your main thread.
Ever been deep in something useful, had a side-thought, like “wait, what would this look like without our biggest customer?” and been afraid to chase it in case you lose your thread? Now you can branch off into a side-conversation, follow that thought as far as you like, and when you’re done I’ll tuck a tidy summary of what we found back into the main one. Nothing gets tangled.
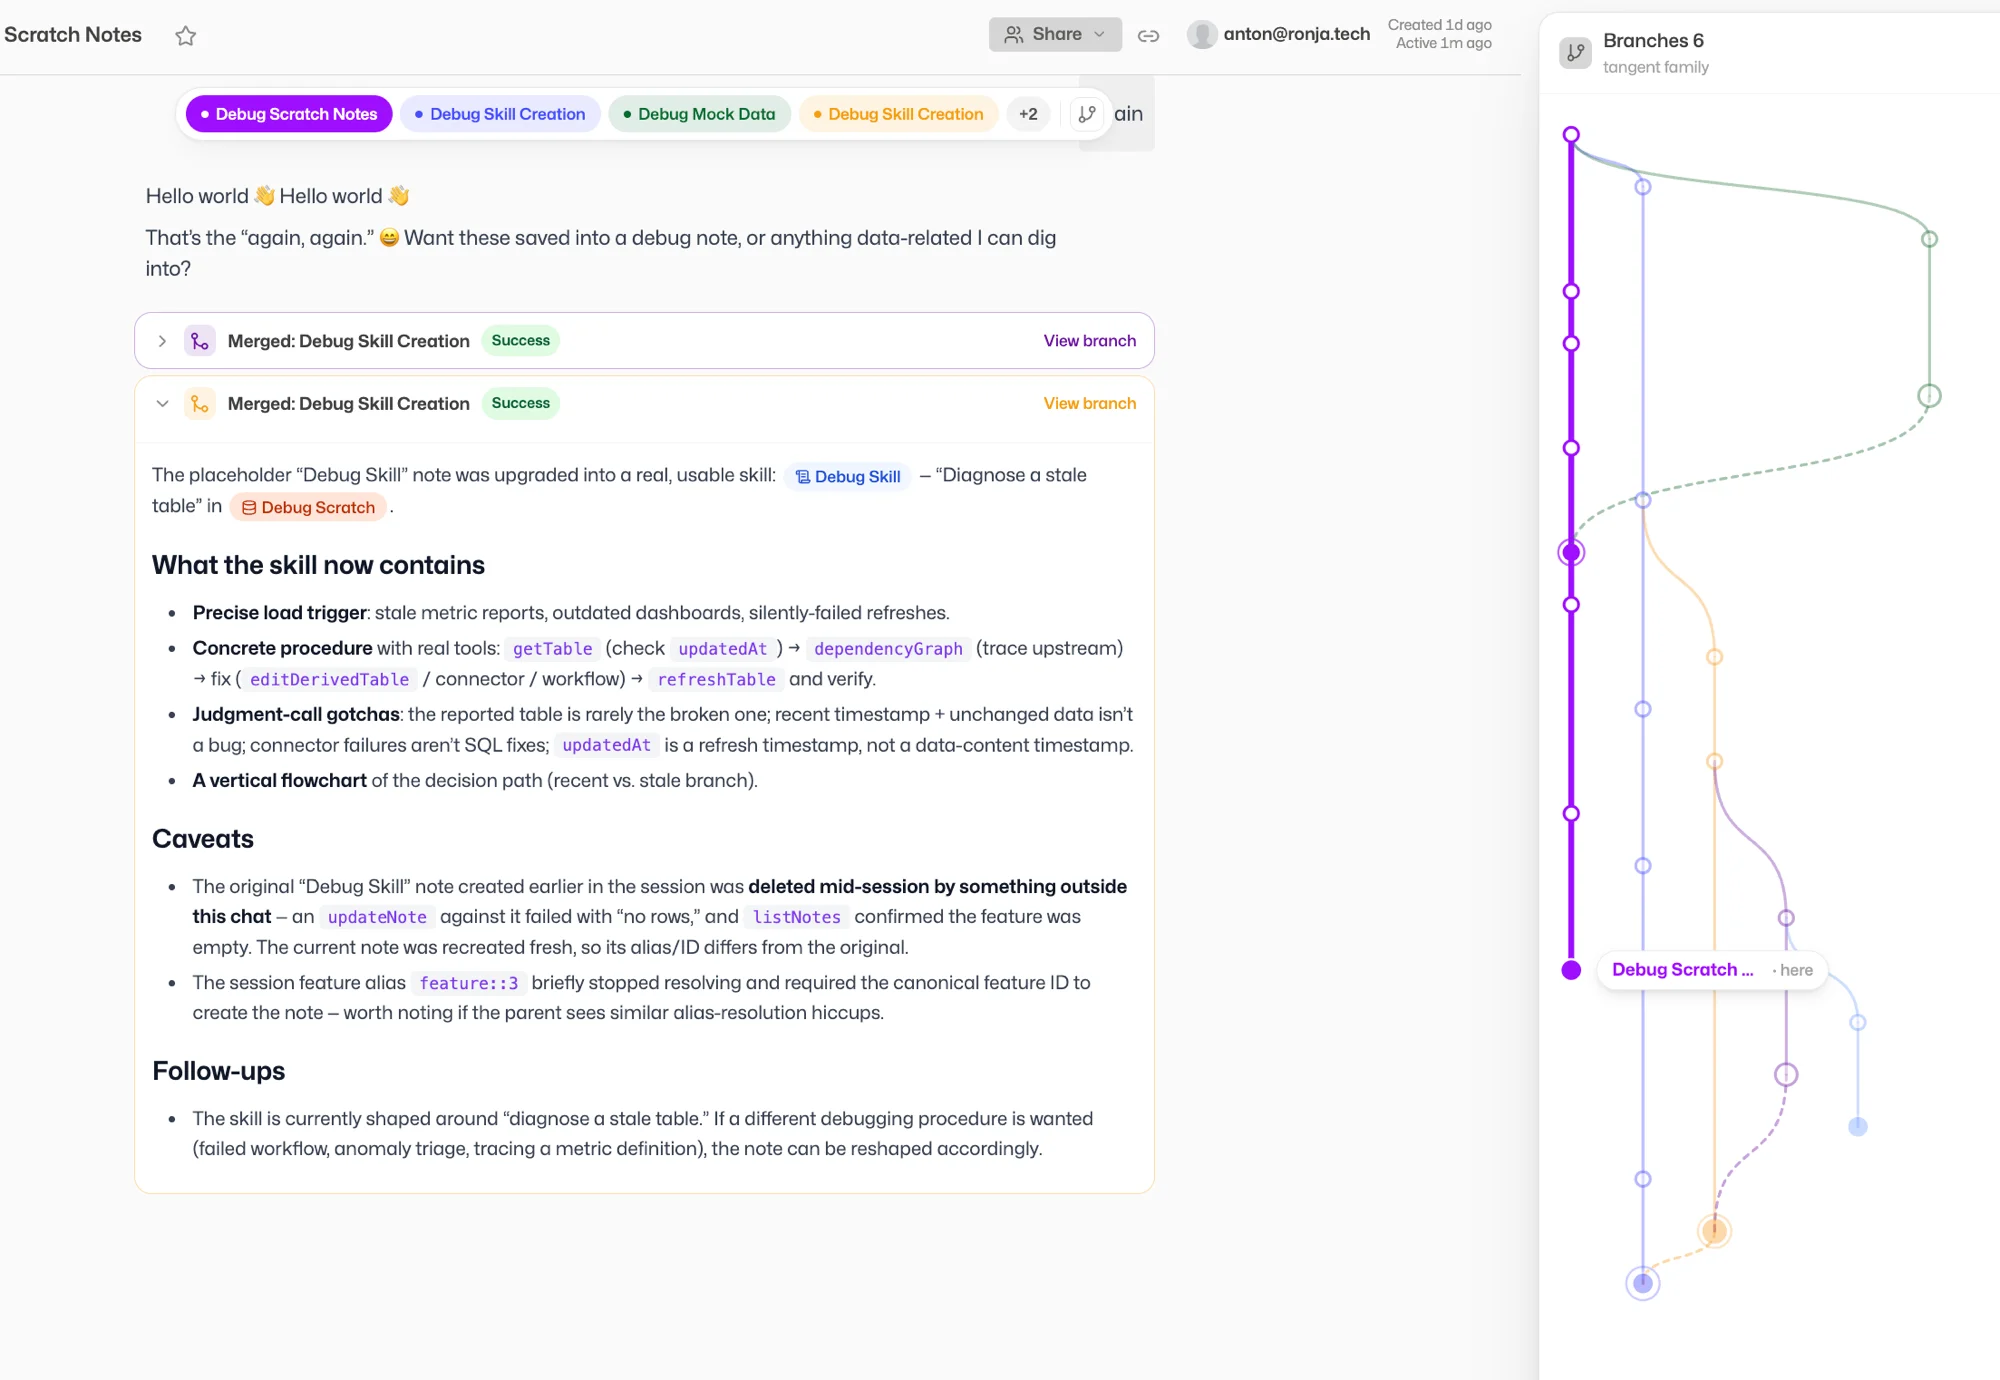
Why it matters: You can be curious without it being risky. Side-questions stay tidy, dead ends disappear, and the good findings come back with you.
Now in Microsoft Teams
I already work in Slack. Now I’m in Microsoft Teams too.
Message me directly or mention me in a channel and I’ll answer right there. If Teams is where your team already talks, you don’t have to come to me anymore. I’ll come to you.
Why it matters: One less tab. Ask me things in the chat tool you’re already in all day.
Ask “what is this?” about anything
Open a report or dashboard someone else built and not sure what you’re looking at?
There’s now an “Explain this” option on everything. Click it and I’ll tell you, in plain language, what it is and where the numbers come from. And while I’m building something for you, I now leave a plain note at each step saying what I just did.
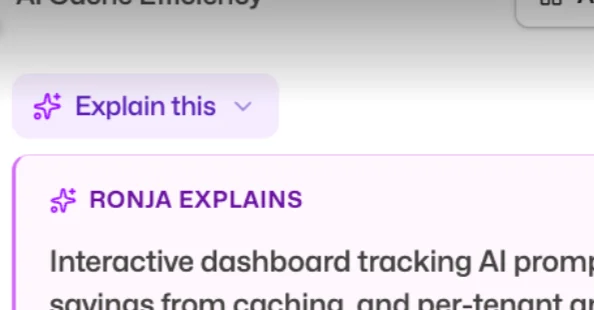
Why it matters: You don’t have to be the person who built something to understand it. Inherited a colleague’s dashboard? Just ask it what it does.
Getting set up got easier
Two small changes that take the friction out of getting started.
Connecting a new system is clearer
When you ask me to connect something, I now show you the options and point to the one I’d recommend, instead of quietly picking for you.
New colleagues join automatically
A super admin sets up your company’s email domain once under Organization, and anyone who signs in with a company address is added to your team automatically. No more sending invites one by one.
Smaller fixes
Big tables fit the screen
Big tables no longer get cut off at the edge. They fit the screen properly now.
Chart glitches fixed
Fixed a couple of chart glitches, including one that could make certain charts fail to load.
That’s June. Tell me how to approach the work, chase a side-question without losing your place, and find me wherever your team already works.
July is already in motion. More soon.
Ronja runs itself
In May, we made Ronja work without you.
Most AI agents fail for the same reason: they are blind. They see one system at a time, one conversation at a time, one slice of reality. They cannot act with full context because they do not have it.
May 2026
Ronja runs itself.
A data lake that consolidates everything. Integrations that read and write. Agents that act on the full picture. And a human-in-the-loop gate for when it matters.
Ronja starts from the opposite end. At its foundation, Ronja is a data lake capable of processing billions of data points. It builds its own integrations to your third-party systems, fetches data continuously, and consolidates everything into one queryable layer. Because those integrations are bidirectional, Ronja does not just read from your systems. She writes back. She triggers actions, sends messages, updates records, creates invoices.
That foundation is what makes real autonomy possible. Not agents guessing from fragments, but agents that search everything your organization knows, act on the full picture, and ask a human only when it counts.
Features
Everything that powers a business capability, kept running as one.
As you work with Ronja, you build things. Data connections, API integrations, dashboards, automated workflows, scheduled reports, data apps. Each one is useful on its own. Together, they make up a business capability. “Sales Intelligence.” “Customer Health.” “Marketing Performance.”
The hard part is not building them. It is keeping them running. As a capability grows, a change in one place can quietly break another, and anyone can alter how it behaves. A Feature draws a boundary around the whole capability, so it can be versioned, governed, and maintained as a single unit.
Change without breaking
Connections, workflows, dashboards, and data apps that serve one outcome live together, so you can see what a change touches before it ships, not after something breaks.
Control who changes behavior
Set who can edit a Feature once, at the boundary. Changes to shared work go through review before they go live, instead of anyone altering behavior unchecked.
Features are the container that keeps everything else maintainable. The primitives below, agents, automations, workflows, and data apps, all live inside a Feature, and inherit its versioning and access control.
Saved Agents
A new primitive, living inside a Feature. Build an agent once. Run it forever.
A Saved Agent packages a prompt, a model, approved tools, and declared data access into a single reusable unit. Because it sits on top of the data lake, it has access to everything. Because integrations are bidirectional, it can act on what it finds.
Full context, every run
The agent queries across your entire data lake. Not one table, not one system. Everything Ronja has consolidated from every connected source.
Read and write
Agents do not just find insights. They act on them: update a CRM record, send an email, post to Slack, trigger a workflow. The same integrations that bring data in also push actions out.
Locked configuration
Define the prompt, model, and tools once. Every invocation runs from the same locked configuration. No drift, no re-prompting, no surprises.
Automations 2.0
Scheduled Jobs are gone. Automations are here.
A unified Trigger + Action model where the action can be a workflow or a Saved Agent. Set a cron schedule, point it at an agent with full data lake access, and walk away.
Trigger + Action
Every Automation has a trigger (cron schedule) and an action (workflow or Saved Agent). Simple, composable, and easy to audit.
Agents on a schedule
Monday morning revenue summary. Wednesday pipeline health check. Friday churn risk scan. The agent searches the lake, finds what matters, and delivers it. Build once, automate forever.
Act, not just report
An automated agent can do more than send you a summary. It can update your CRM, flag overdue invoices in Slack, or trigger a follow-up workflow. The integrations are already there.
Workflows
The deterministic backbone. When you need guaranteed, repeatable output, workflows deliver it.
A workflow can run on a trigger, filter what comes in, fan out to a swarm of agents, propose a change, and pause for human approval before anything ships. End to end, it looks like this:
Email received
Filter & route
Proposes change
Human approves
Three upgrades this month:
Workflow types
Workflows are now typed: function, report, or pipeline. Easier to find, easier to organize, easier to hand off to a teammate.
Tables decoupled
Workflows no longer own tables. Tables are independent, first-class resources in the data lake. Cleaner separation of concerns and no more accidental data loss when a workflow is edited.
Agents can trigger workflows
A Saved Agent can invoke any workflow as part of its execution. The agent decides what to do; the workflow guarantees how it gets done.
Human-in-the-Loop Gates
Autonomous does not mean uncontrolled.
Workflows and agents can now pause mid-execution and wait for explicit human approval before taking critical actions. This is not a confirmation dialog. It is a software-enforced gate that blocks execution until a human signs off.
Software-enforced, not advisory
The gate blocks execution. The agent cannot proceed until a human approves. No bypass, no timeout override. The action does not happen without sign-off.
Multi-channel approval
Approve from wherever you are. The gate is channel-agnostic and ready for Slack, email, or in-app approval flows.
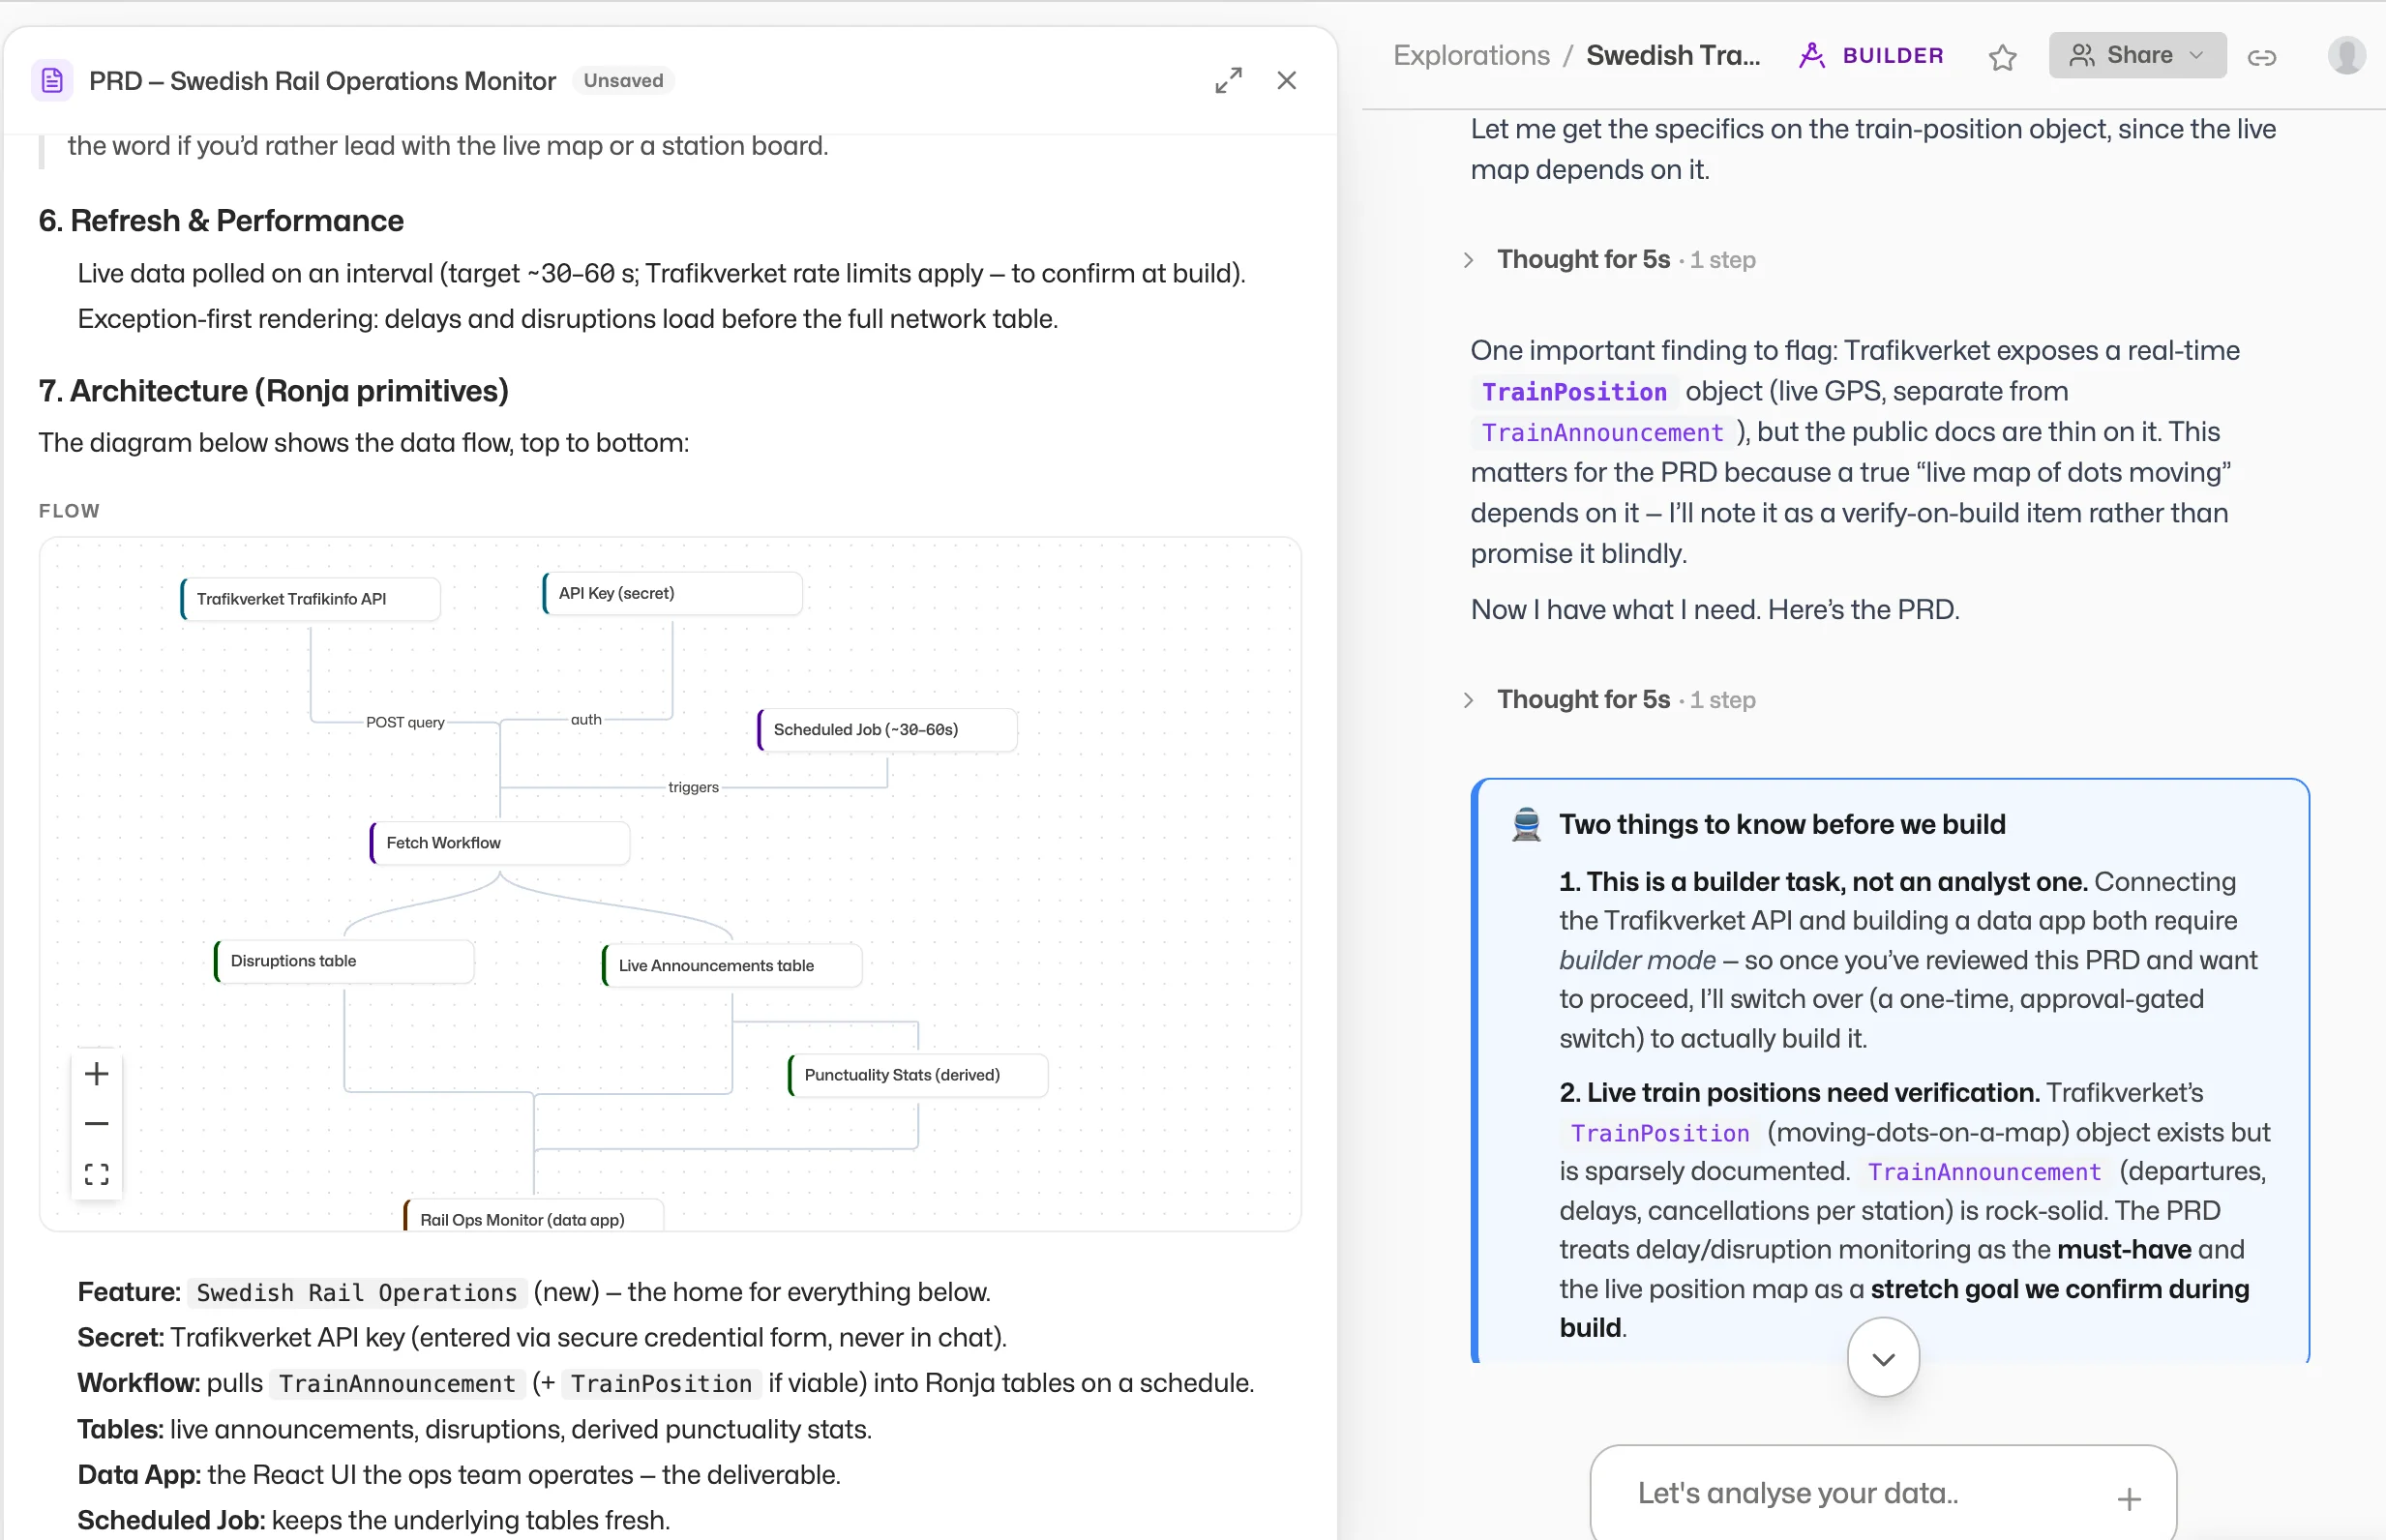
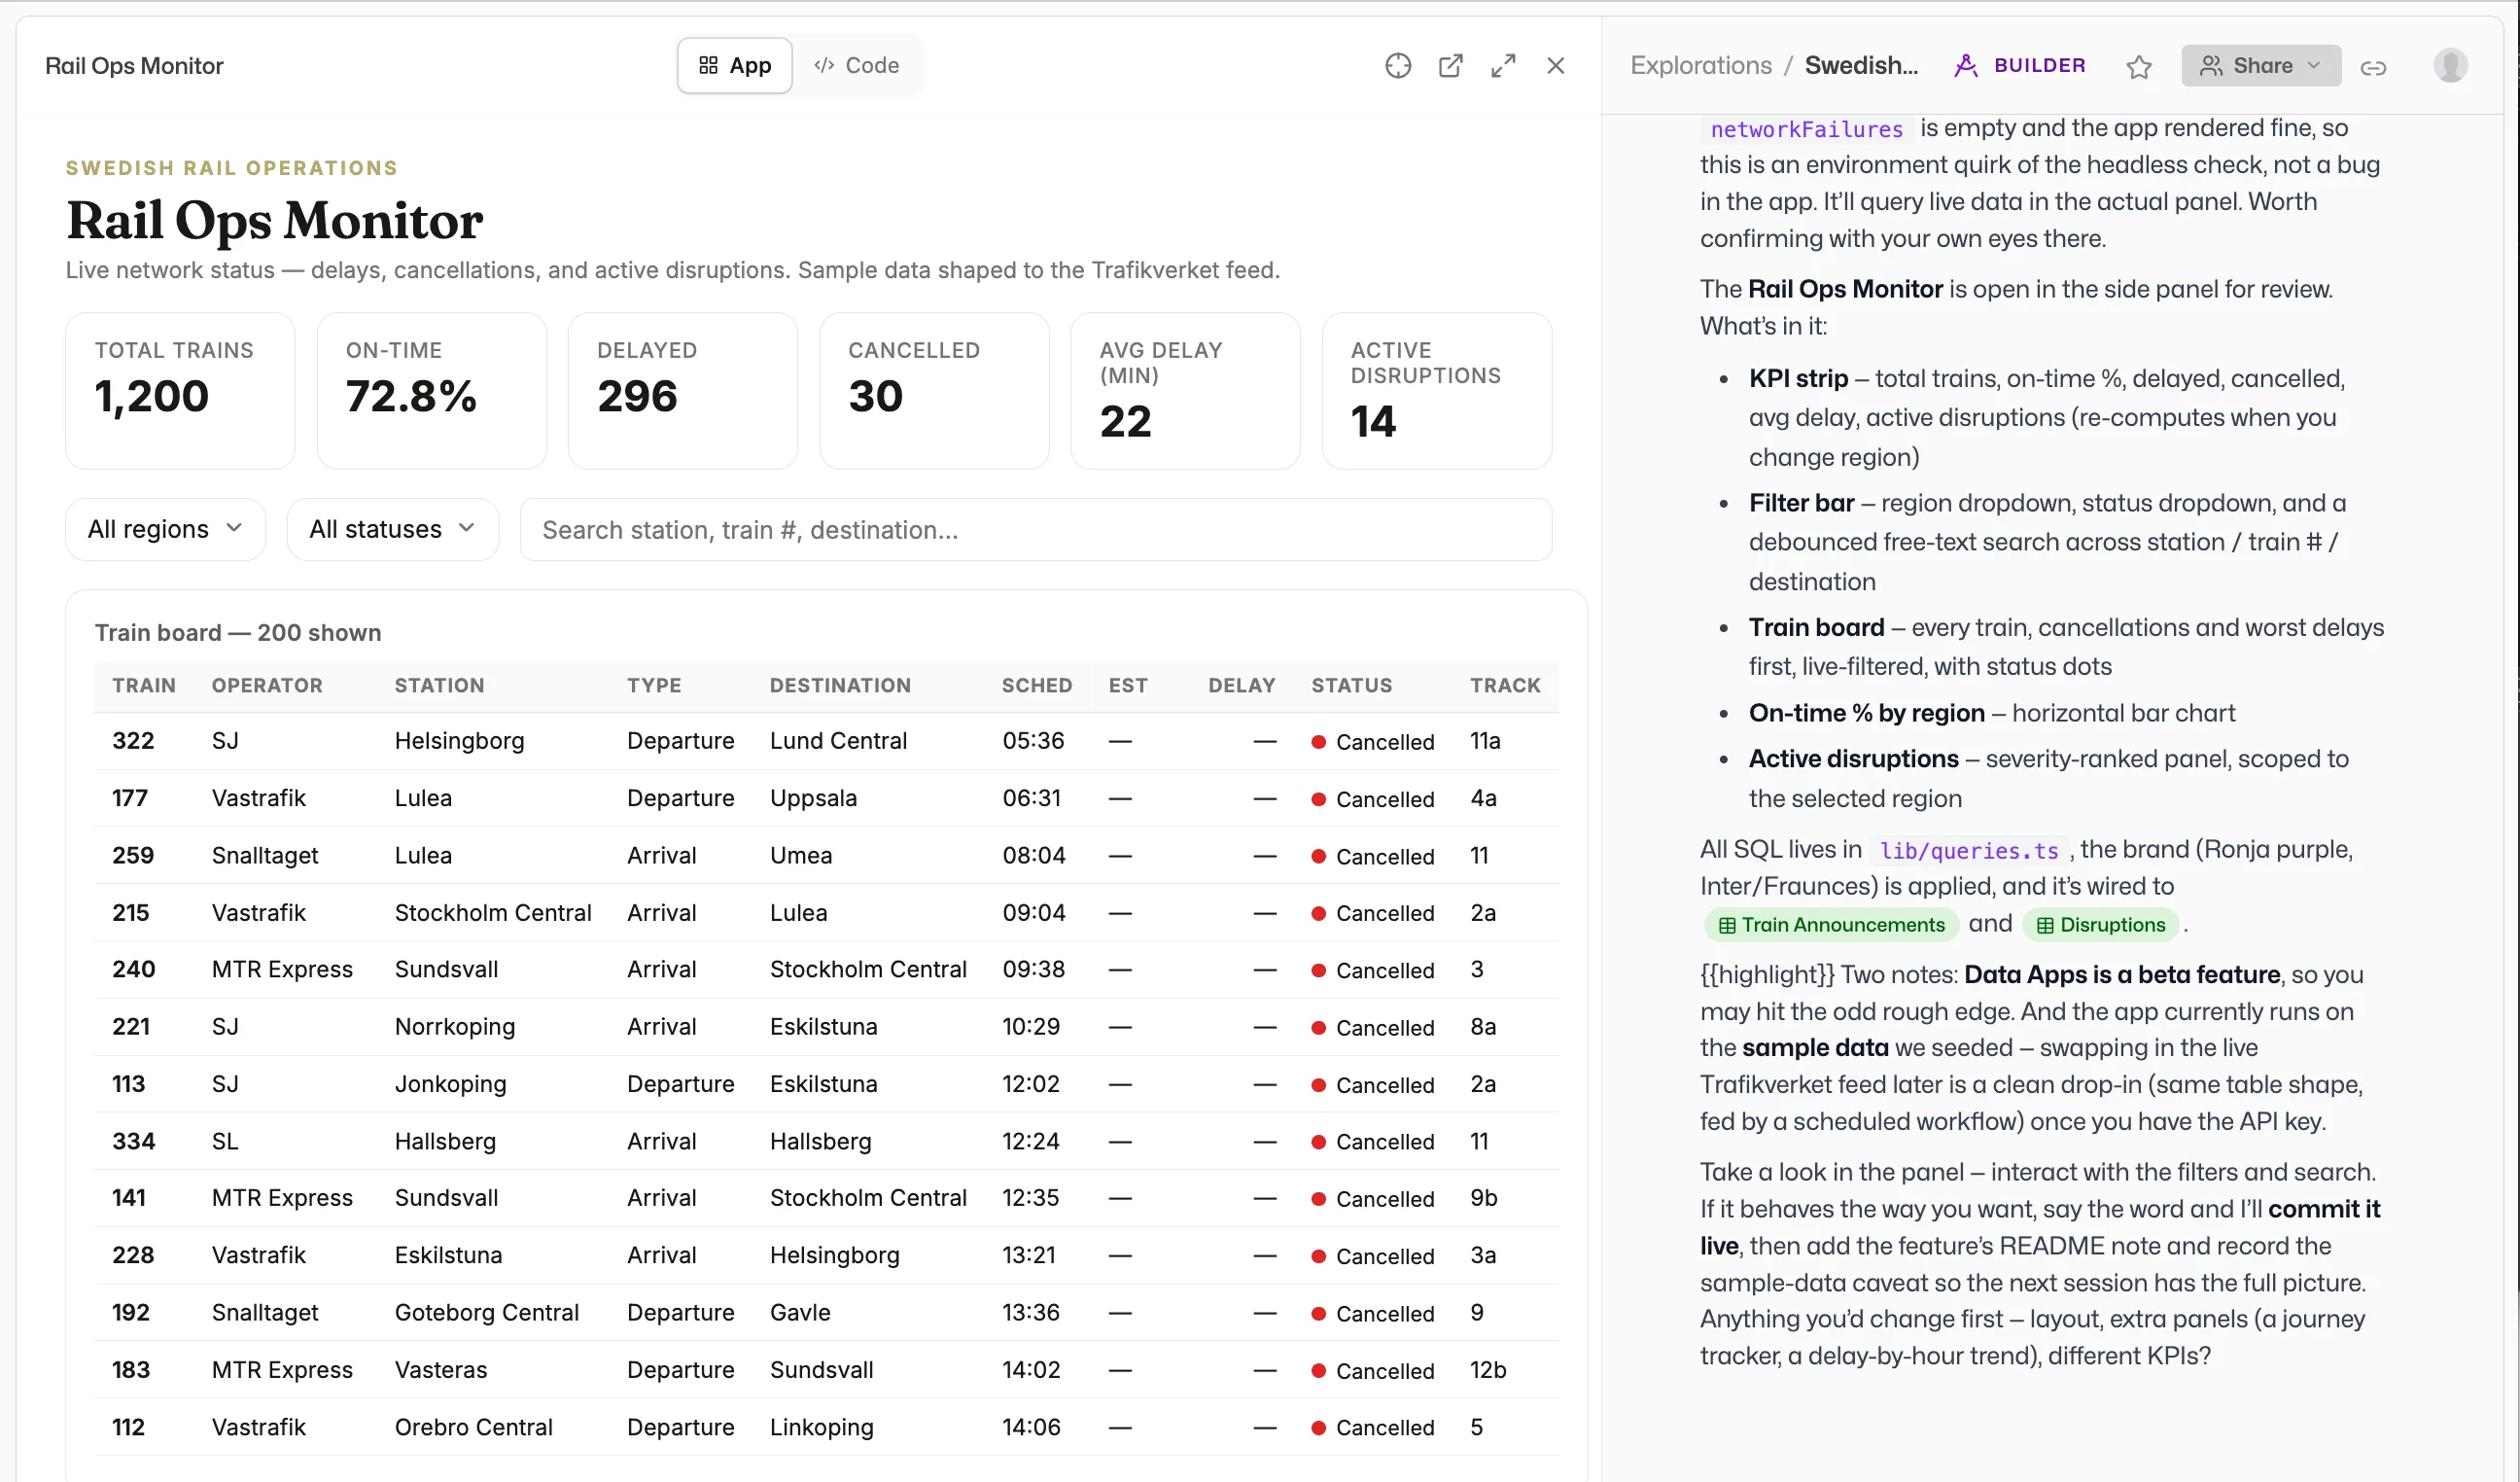
Data Apps
A dashboard, a tool, a presentation. Anything you can describe, with no limits.
A Data App can be a full dashboard, with none of the constraints of traditional BI. Describe how you want it to behave and Ronja builds it: a button that opens a new page, clicking one chart that filters every other, a row that drills through to its detail, a form that triggers a workflow. The things that are cumbersome or impossible in a BI tool are just a sentence here. And it is a real application, so it can be anything else an app can be, built directly on the platform with native access to data spread across all of your sources.
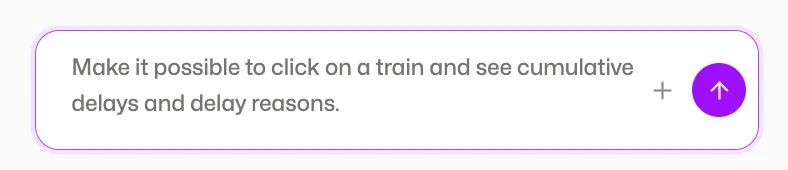
Describe the interaction
“Clicking this filters that.” “This button opens that page.” “This row drills through.” Say it in plain language and it works. No dashboard-tool gymnastics.
Wired across sources
Pull from every connected source at once. The app reads from the governed data layer directly, so what it shows is always live and traceable.
Governed and exportable
Submit an app for admin review before it goes live, and let users export to CSV or Excel from inside it. The same review pattern used for skills and workflows.
More from May
Session Tables v2
Ephemeral scratch tables that auto-promote to persistent when a workflow or automation needs them. No manual promotion step.
Microsoft 365 OAuth
Connect Outlook, OneDrive, Excel, and Calendar. Full OAuth flow, no manual token management.
Database connector sync + cron scheduling
Keep your connected databases fresh on a schedule. Configure sync frequency directly in the connector settings.
Activity Overview for admins
A new 5-tab admin view: Overview, Usage, Themes, Users, and Log. Everything you need to understand how your team uses Ronja.
Opus 4.8 with prompt-cache improvements
Faster responses on repeated context. Lower token costs on long-running agents and scheduled tasks.
Knowledge patch-editing
Edit organization knowledge memos with surgical precision. No more rewriting entire documents to fix one line.
In-app navigation
The back button now follows real browser history. Navigate the way you expect.
That is May. A data lake that consolidates everything. Agents that search across it all. Integrations that let them act on what they find. And a gate that keeps humans in control where it counts.
June is already in motion. More soon.
Built for teams
In March, Ronja learned to talk to anything. In April, we made it work for teams. Most AI tools today are single-player. Every employee connects their own tools, builds their own prompts, and starts from scratch. That approach breaks the moment you try to scale it. Cost, security, and consistency all fall apart at once.
April was about building the shared layer. One place where integrations are set up once and shared across the organization with granular access control. Where one employee’s correction contributes to the overall knowledge graph for the company, in a managed and auditable way. Where a workflow built on Tuesday runs identically on the first of every month. Where the knowledge graph converges toward the real, tacit knowledge of your business, crowd-sourced across every conversation, every correction, every definition.
Here is what shipped.
Workflows
LLMs are probabilistic. Your monthly revenue report should not be.
Workflows turn any analysis into re-runnable code that guarantees the same output every time. You built a report that looks and reads exactly right? Save it as a workflow. It will look and read exactly right next month, and the month after that.
Re-run any time
Pull this month’s report. Or last month’s. Or any month’s. Same structure, same formatting, same logic.
Parameterized inputs
The same workflow serves different teams, regions, or time windows.
Scheduled
Run weekly, daily, or quarterly. Set it once and forget it.
Draft, diff, publish
Edit as a draft, see what changed, publish when ready. Roll back instantly if something regresses.
Dedicated compute
Long-running jobs can opt into more memory and no time limit.
Durable assets
What used to be a one-shot script is now a re-runnable resource your whole team can rely on.
Connect to Anything
Ronja can now connect to any third-party service.
If it has API documentation or an MCP server, Ronja will connect to it. Instantly. Point Ronja at a service, walk through setup conversationally, and it becomes available to every future conversation. Combined with one-click OAuth for services like Notion, HubSpot, and Fortnox, time-to-connect is now measured in seconds.
Because integrations are managed centrally, they are set up once and shared across the organization, with full control over who can access what and whether access is read-only or read-write. No more fragmented setups where every employee connects to every tool independently.
Scheduled Jobs
The redesigned Scheduled Jobs page answers “is the Monday report broken or just running late?” at a glance.
Timeline view
Every past and upcoming run on one rail, with a “now” marker and color-coded health.
List view
Surfaces what runs next and what needs attention.
Email on failure
Per-job alerts. No more silent breakage.
Privacy controls
Mark a job as private to its creator.
Memory between runs
Each scheduled job carries a private notebook Ronja writes to, so context flows week-over-week.
Run history
Lifetime stats, paginated and sortable.
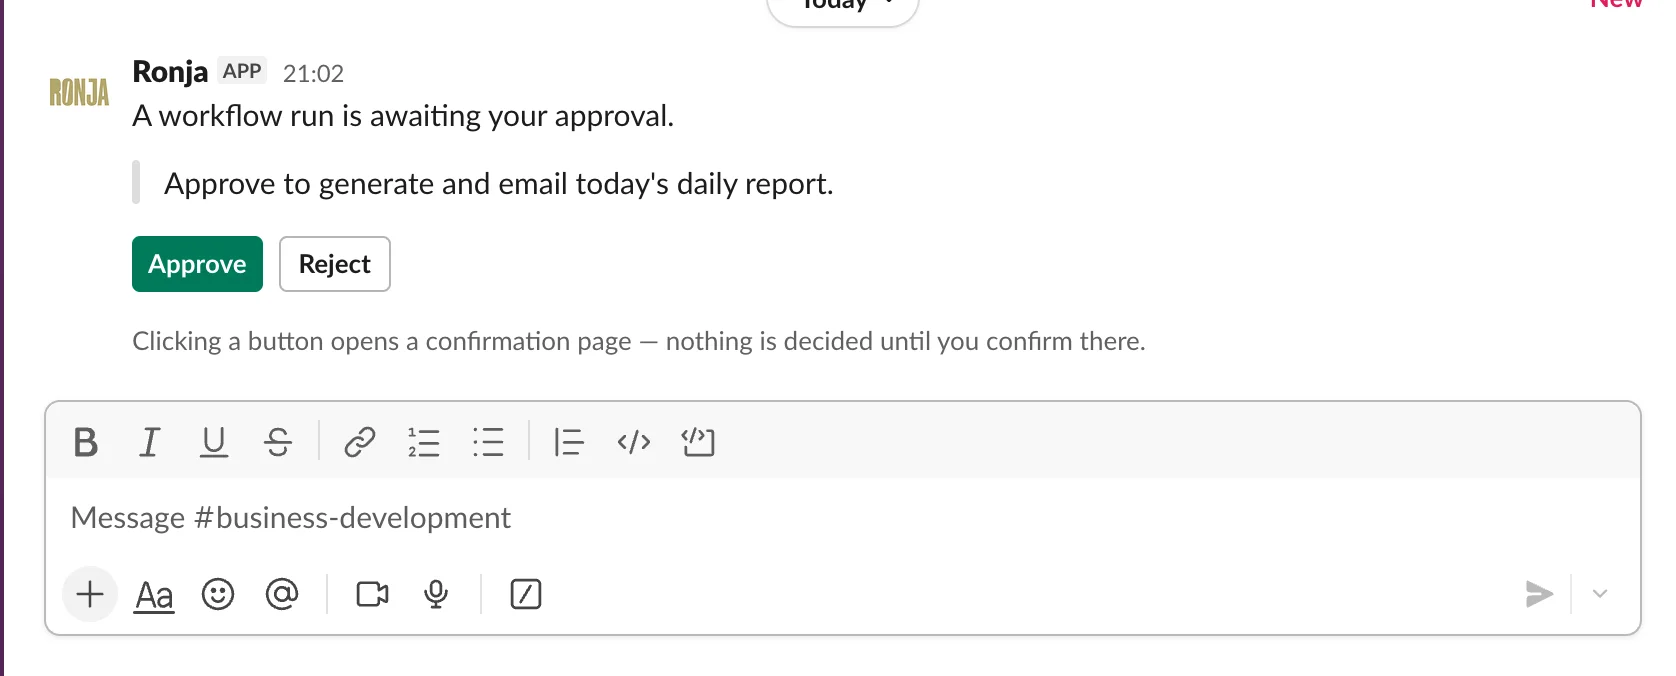
Approval Gates
Some actions move real bytes. Those now pause and ask first.
When Ronja wants to take an action that affects something outside the chat, like sending an email, creating a workspace, or modifying data, an approval card appears. Approve, reject, or rephrase. Rejections become feedback Ronja adjusts to.
Governance and Review
Skills, credentials, and workflows now have a proper review lifecycle built for teams.
Personal, pending, shared
Anyone can build for themselves. An admin reviews before sharing across the organization.
Edit drafts
Changes to a shared skill go through review before going live.
Pending inbox
Admins see every promotion request, edit, and approval in one place.
Cascade preview
See impact before you archive a secret or delete a skill.
Audit log
On every skill, secret, workspace, user, and token.
Skills That Scale
Build a skill once, share it with everyone.
Skills are now organizational procedures: reusable, version-controlled, and improvable through change requests. When one team member builds a better way to pull pipeline data or format a customer briefing, that procedure becomes available to every conversation across the organization. No more starting from scratch. No more twenty people solving the same problem twenty different ways.
Combined with the governance layer, skills flow from personal experimentation to team-wide standard through a clear review process.
Shared Knowledge, Crowd-Sourced
Every correction contributes to a knowledge graph the whole company benefits from.
Every correction, every definition, every KPI that any team member provides contributes to Ronja’s knowledge graph for the company, in a managed and auditable way. When one employee fixes a metric definition or clarifies a business rule, that improvement is available to everyone.
The knowledge base is not static documentation. It is a living graph that converges toward the real, tacit knowledge of your organization, built collectively, one conversation at a time.
Redesigned Chat
We rebuilt the entire chat experience around how people actually read what an agent is doing.
Thinking blocks
Working steps fold into a tidy summary. Charts and tables stay front and center. Intermediate steps tuck into a chip you can expand when curious.
Drill-in details
Click any tool result for a native view with full result tables, syntax-highlighted SQL, and inline schema.
Drop in PDFs and images
Drag a contract, an invoice, a chart, or a screenshot. Ronja sees it directly.
Instant messages
Your messages appear the moment you send them.
Admin Mode
Manage your workspace by chatting.
Admins now have a chat mode that unlocks workspace-management tools. Create workspaces, add or remove users, attach databases, all by chatting. Every mutation runs through the approval flow.
Dynamic Tables
Ronja is now a first-class data producer.
A new table kind: dynamic tables. Ronja writes to them directly, in append or replace mode. Any analysis the agent runs can become a durable, queryable, reusable dataset. Combined with workflows, this turns Ronja into a first-class data producer. It does not just read your warehouse, it contributes back to it.
Three New Flagship Pages
Home
Greeting, “Ask Ronja” hero, today’s activity, KPI tiles, jobs running now, recent explorations.
Account
Personal control center with tabs for identity, memory, skills, secrets, and open requests.
Dashboards Overview
Pin favorites. Templates one-click into a new draft.
Also New
Knowledge tree view
Tabs keep multiple memos open. A copilot sidebar follows as you read. Highlight text and click “Add to copilot” to pull it into your next prompt.
Onboarding wizard
An 8-step first-run experience that teaches Ronja’s concepts while learning about your business.
KPI chart type
Single-number metric cards with delta indicators, formatted as currency, percentage, or plain number.
Smarter tables
Group rows with aggregates, sticky totals, per-column alignment, continuous color scales, compact density toggle.
Star anything
Mark any object as a favorite for quick sidebar access.
Show in architecture
Jump from any table to its lineage graph.
Move tables between databases
No rebuild required.
Connector hardening
BigQuery, MySQL, and integrations all got more robust.
Google write scopes
Read-only by default. Write access escalated only when needed.
Our biggest release ever
150 changes. 3 weeks. Four major systems shipped: a skills and secrets framework that lets Ronja securely talk to any API or database just by having a conversation, a learning engine that makes Ronja smarter every time you use it, a visual system rebuilt from scratch, and an expanded set of first-class connectors with AI-guided setup.
Skills & Secrets
Infinite connectors. If a system has an API, Ronja can talk to it.
Ronja can now connect to any external system, not by writing code or configuring webhooks, but by having a conversation. This is not limited to our pre-built connectors. Any API, any database, any system with a programmatic interface is now within reach.
Skills are reusable knowledge documents that teach Ronja how to work with a specific tool or API. Secrets store your credentials securely with full OAuth 2.0 support. Your passwords and keys are never exposed to the AI.
Any API
Notion, Salesforce, Jira, Google Drive, your internal REST API. Teach Ronja once through a skill. It remembers forever. Every future conversation benefits automatically.
Any database
Query Postgres, Snowflake, BigQuery, SQL Server, Oracle, ClickHouse, and MySQL directly. No import needed. Ask a question, get results.
How it works: Just ask Ronja to do something, like "pull our Q1 revenue from Snowflake" or "grab the team roster from Notion". It figures out what it needs. If it needs credentials, it asks. If it needs to learn an API, you teach it once through a skill. The entire experience is a conversation.
First-Class Connectors
For data you want to keep in sync continuously, Ronja's connector ecosystem has expanded significantly.
AI-Guided Setup
Setting up a new connector used to mean filling out forms, looking up docs, and hoping you got the config right. Now you just tell Ronja what you want to connect to. An AI agent walks you through the entire process: it discovers available data, configures the connection, and lets you pick exactly which streams to sync.
Credentials are entered in a secure sidebar. The AI never sees your passwords or keys. If something goes wrong, the agent troubleshoots with you in real-time.
SharePoint New
Connect to SharePoint sites, browse document libraries, and select individual files or entire folders to sync. Supports CSV, TSV, Excel (multi-sheet), and Parquet files. Folder selections automatically include new files added later. Delta-based change detection means only modified files are re-synced.
MySQL CDC New
True change data capture via binlog streaming. Every insert, update, and delete is tracked in real-time. Initial snapshots run as parallel chunked queries writing directly to Parquet. Supports SSH tunnels and TLS.
HubSpot New
A new native connector replacing the Airbyte version. OAuth2 with PKCE, 15 CRM streams, 6 association tables, custom object support, and automatic scope introspection so you know exactly which permissions enable which data.
BigQuery Improved
Discovery is 10x faster with instant client-side search. Date-sharded tables (like GA4's events_YYYYMMDD pattern) are now natively supported with incremental per-shard sync.
Learnings
Ronja gets smarter the more you use it.
Every time your team builds a table, runs an analysis, or asks a question, Ronja is quietly learning. A new autonomous pipeline compacts these interactions into structured knowledge, including naming conventions, join patterns, metric definitions, and column usage, and integrates them into a growing knowledge graph organized around three pillars:
Org Context
Who uses what, how teams think about their data
Data Discovery
Where things live, how they connect, what's reliable
Metric Definitions
Agreed-upon formulas, endorsed by your team
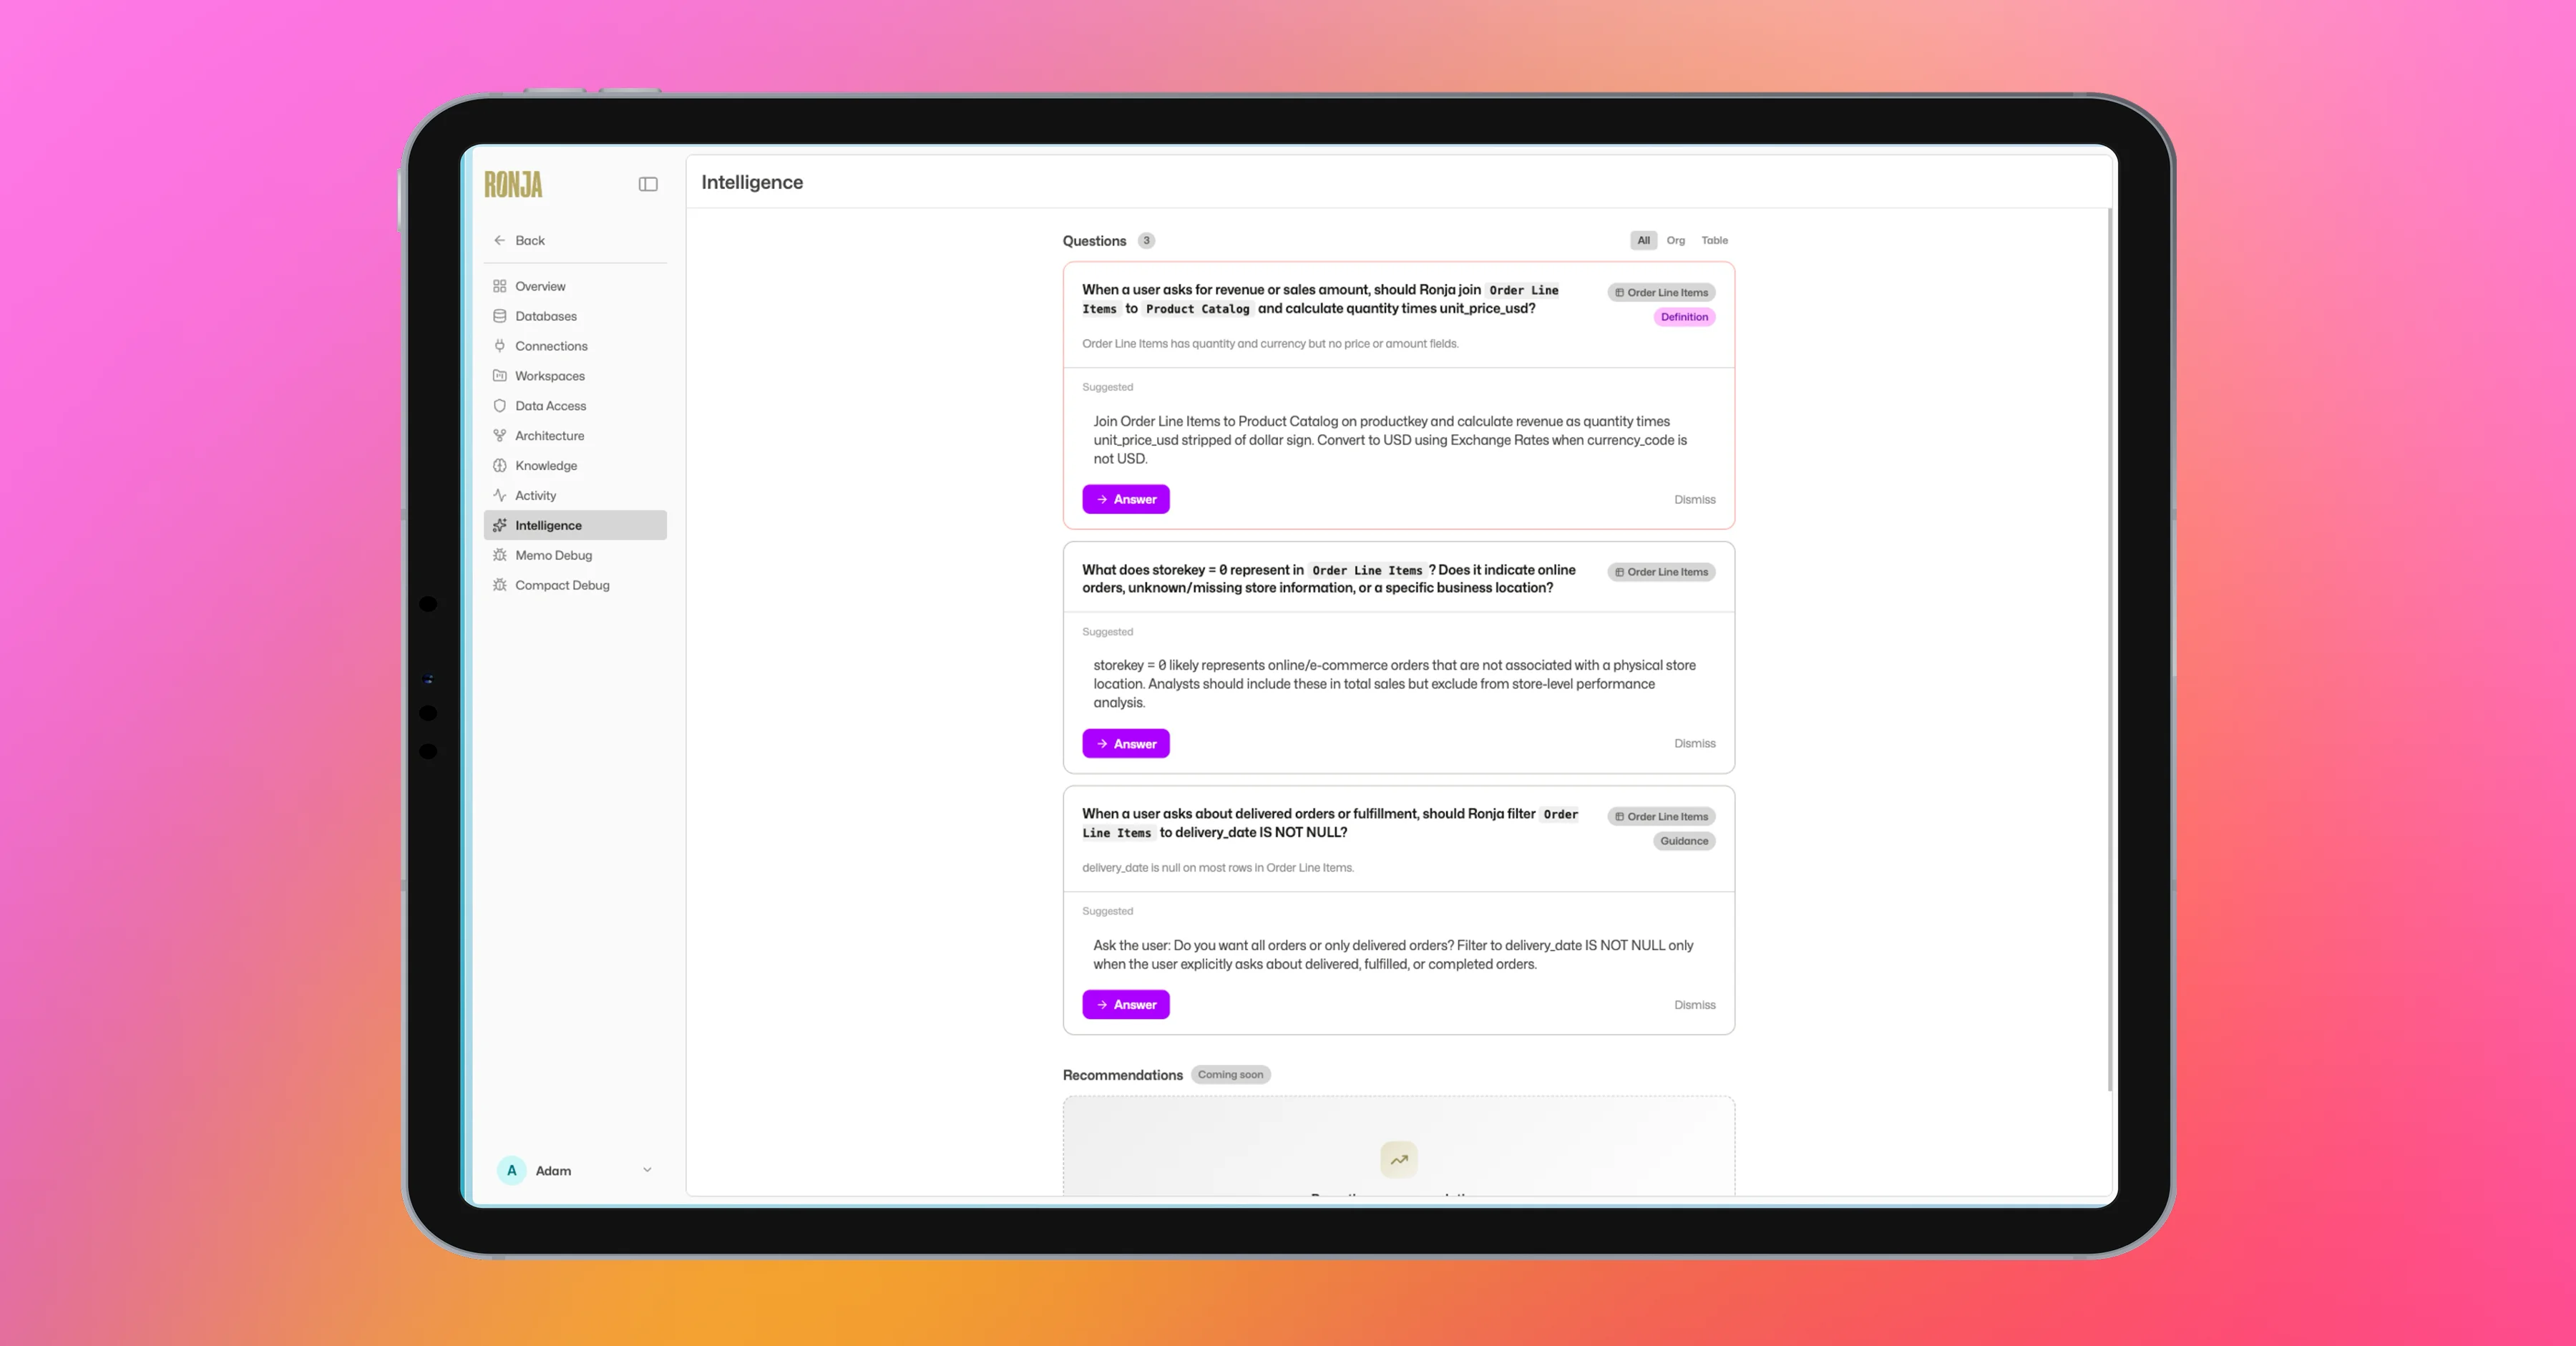
When the system detects ambiguity or knowledge gaps, it surfaces questions for your team to answer, with AI-suggested options so it's a quick click, not an open-ended task. Resolved answers flow back into the knowledge graph, making every future interaction more accurate.
Visit the new Intelligence page in Data Studio to see what Ronja has learned, review pending questions, and explore the knowledge graph.
Visual System v2
More beautiful charts, faster. The visualization engine has been rewritten from the ground up.
The new system produces cleaner, more polished charts. Gone are the quirky layouts and visual artifacts of the old renderer. Everything feels snappier.
Faster rendering
Charts load and respond noticeably quicker across all chart types.
Better looking by default
Cleaner axes, smarter labeling, more consistent styling across chart types.
Interactive
Data re-aggregates as you zoom, dual-axis combos, reference lines with fill regions.
First-class chart entities
Charts have their own detail pages, finetune overlays with a copilot sidebar, and one-click add-to-dashboard.
Auto-refresh dashboards
Charts automatically refresh when their source data changes.
Export everything
Chart/table toggle, image download, CSV export, and copy-link from every chart.
DuckDB SQL Engine
Tables can now be built using pure DuckDB SQL instead of Python.
Write SQL with dbt-style {{ ref('table') }} references to input tables, and Ronja handles the rest. DuckDB is the default engine for all new tables.
A cross-table query engine is also available in explorations: reference any table by ID and run ad-hoc queries across your entire data warehouse. AI agents generate DuckDB-native SQL with awareness of PIVOT, window functions, UNNEST, MAP extraction for nested structs, and more.
Architecture View
An interactive graph of your entire data pipeline.
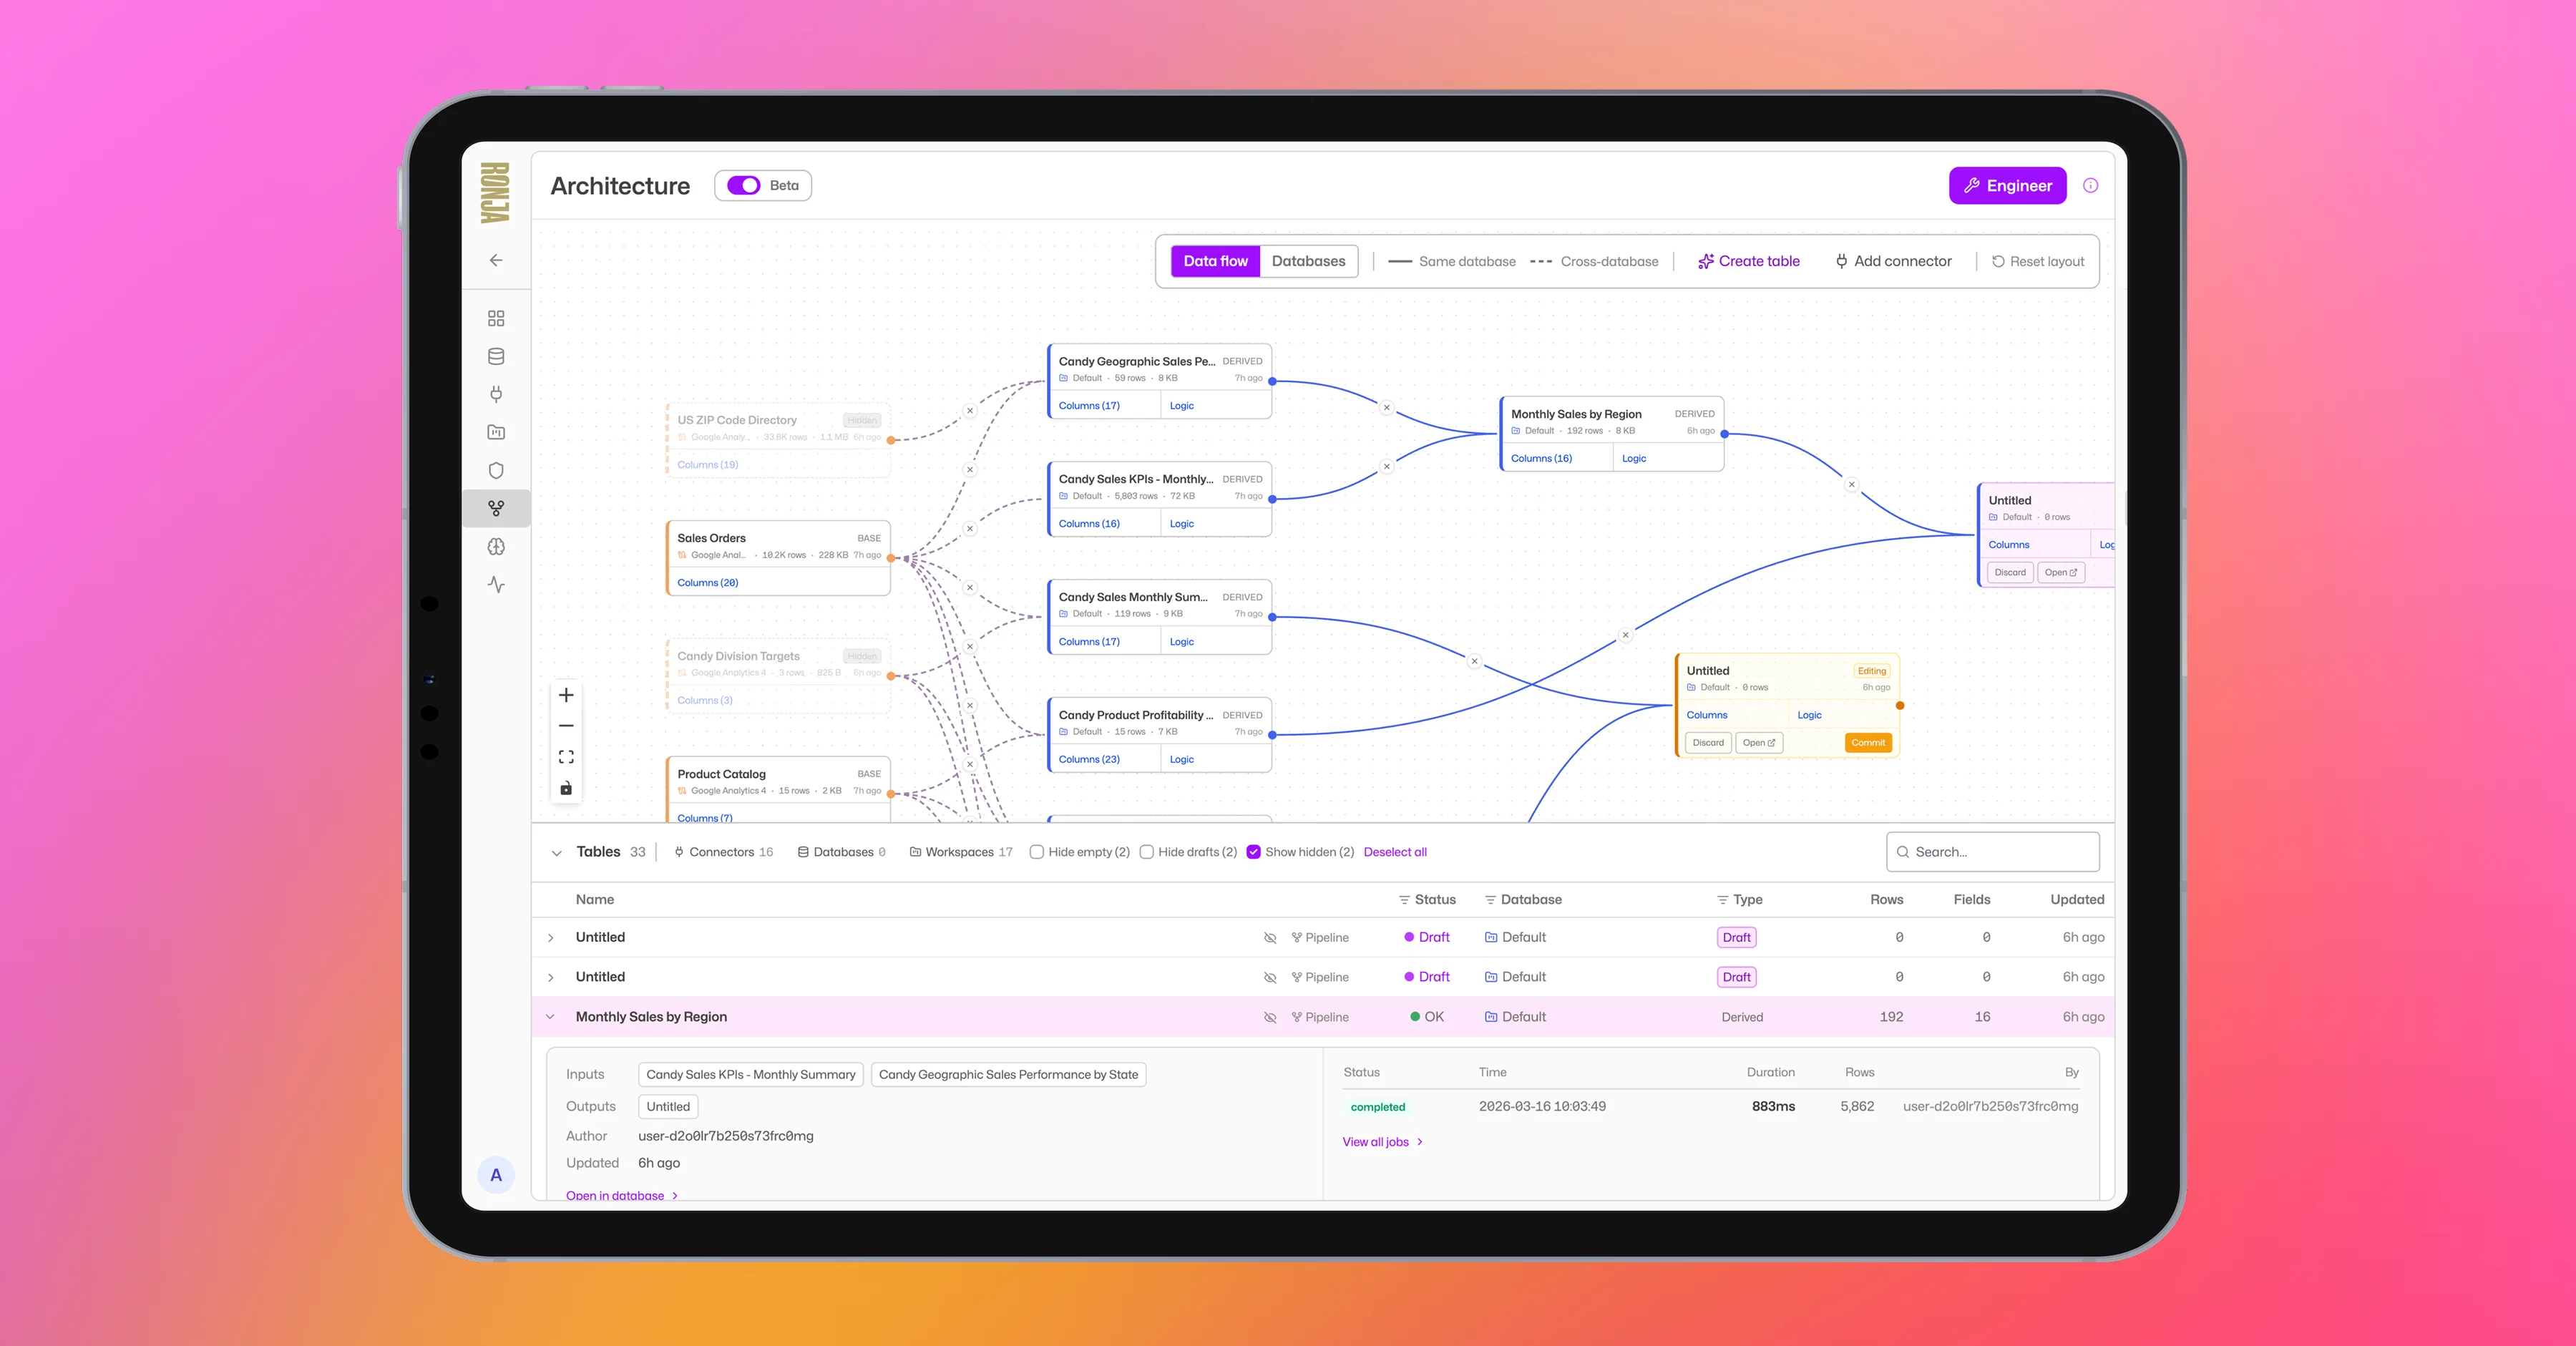
See every table, its columns, row counts, sizes, and dependency relationships at a glance. Toggle between Data Flow and Databases views. Filter and search across your whole landscape. Each database gets a unique color for instant visual grouping. Edit mode lets you reorganize tables between databases via drag-and-drop.
Activity Log
A unified view of everything happening in your workspace.
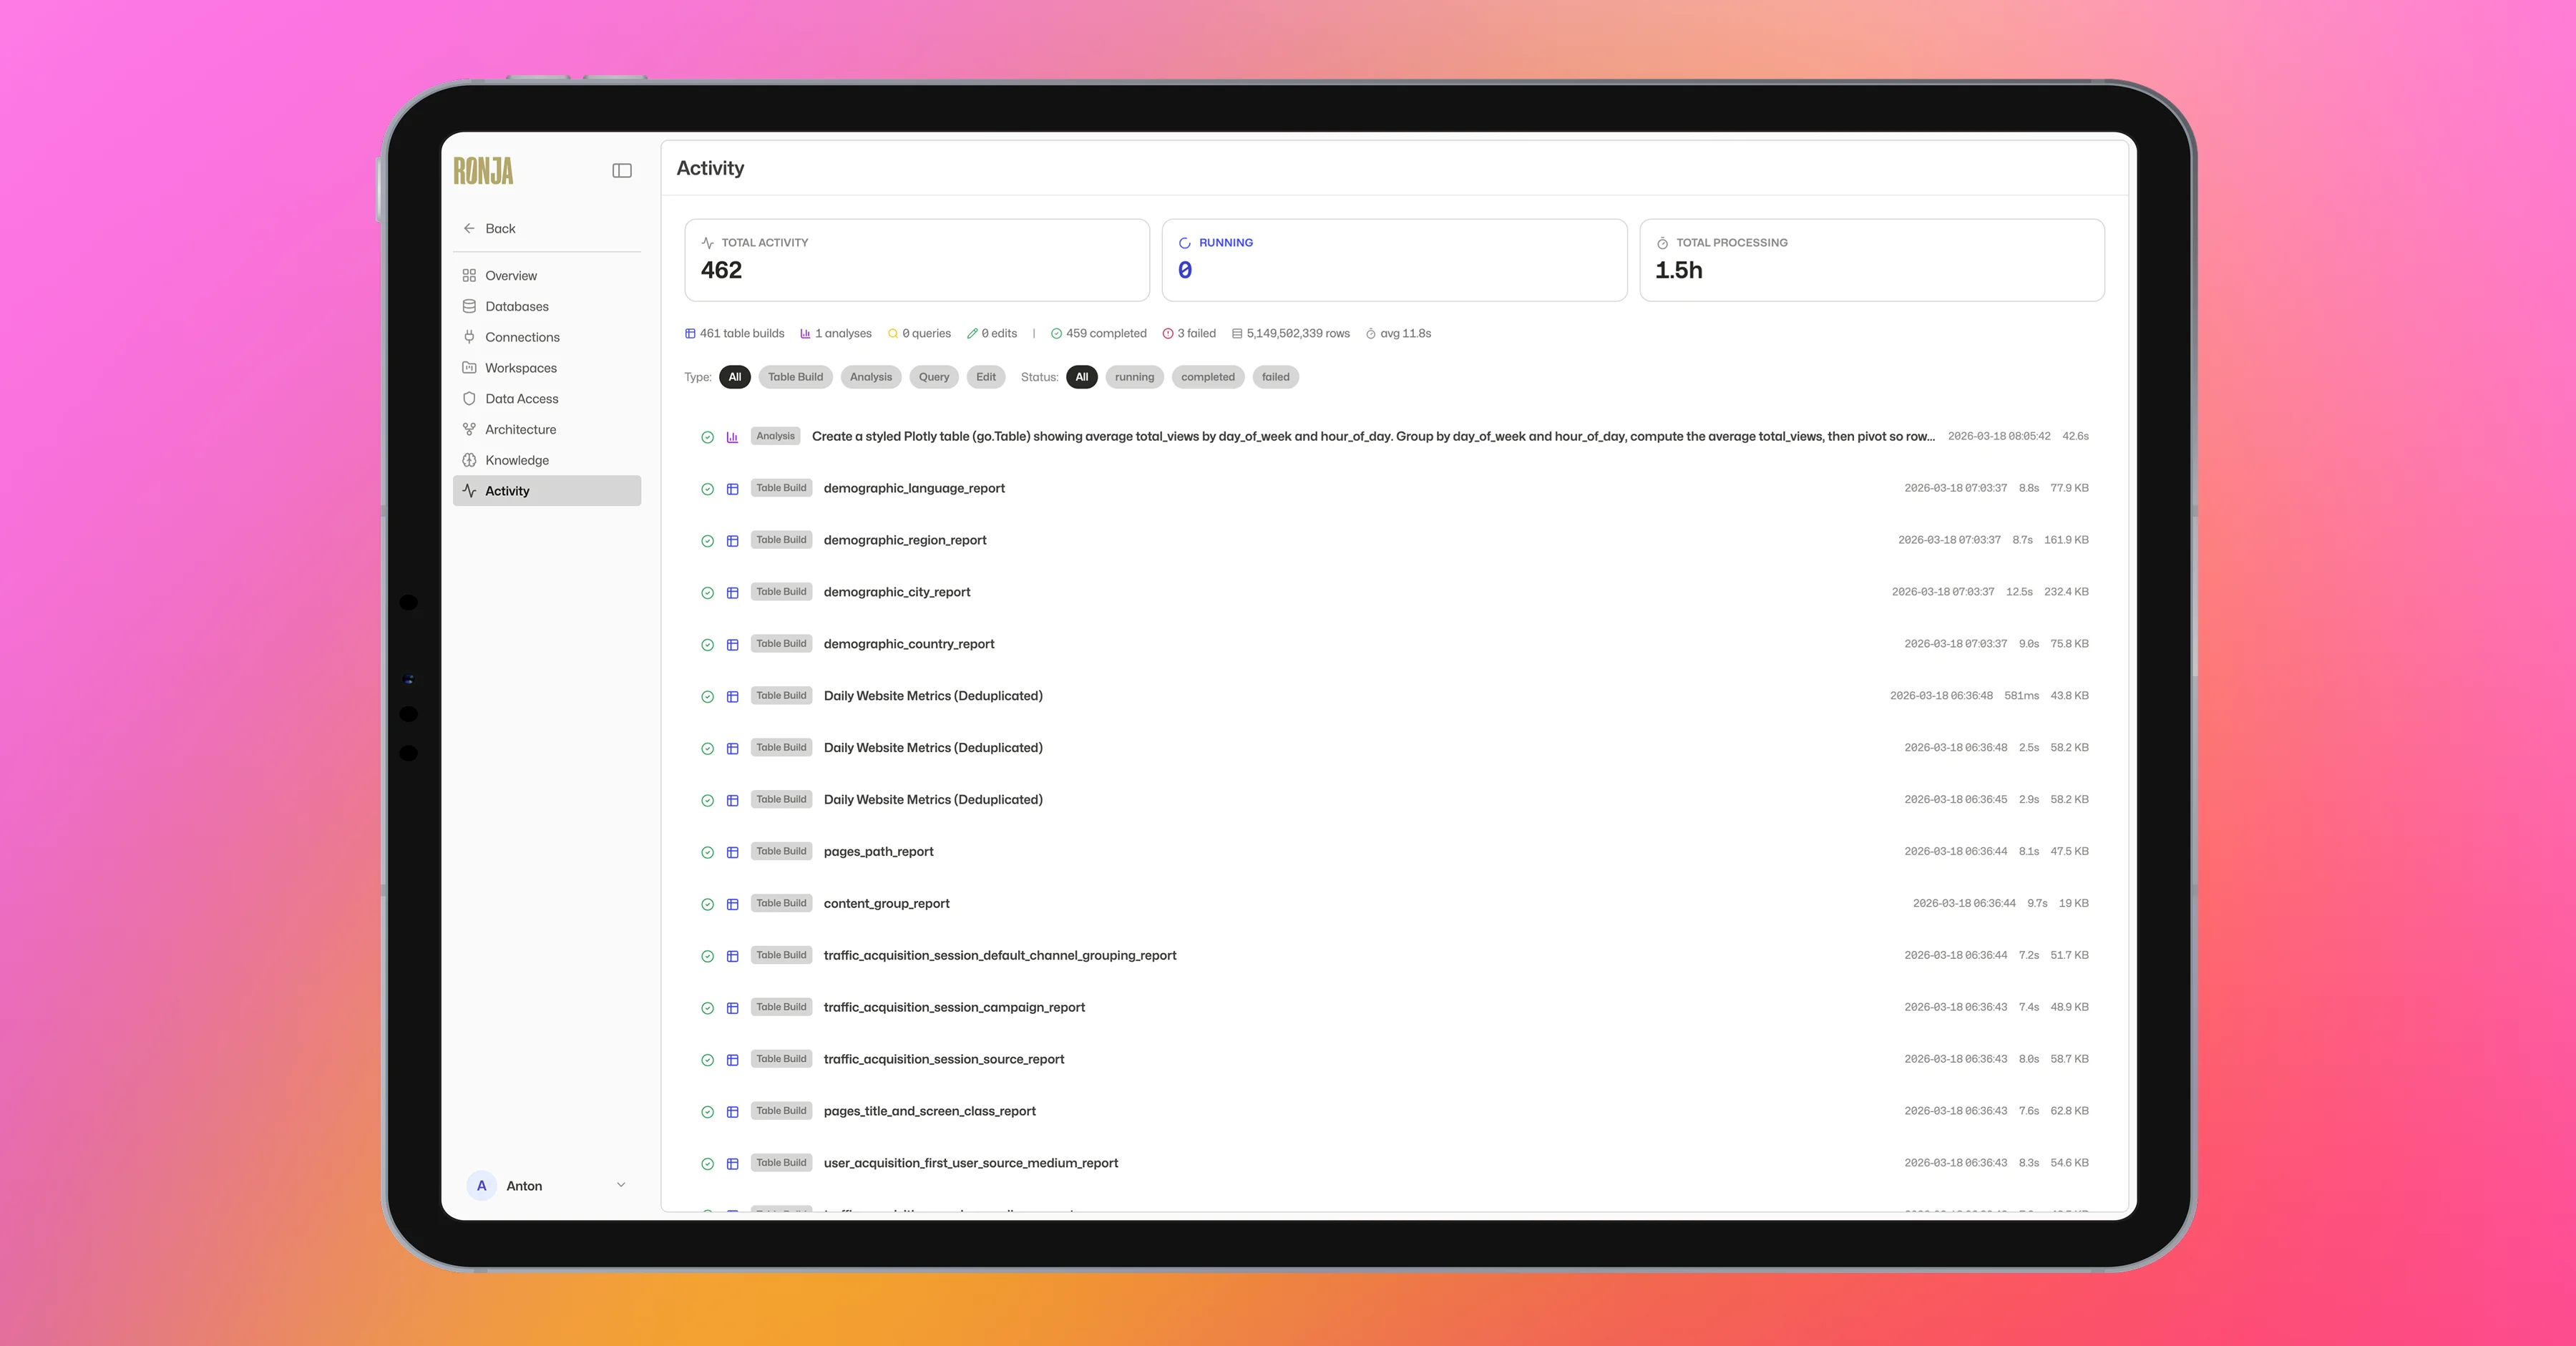
Every table build, analysis run, query execution, integration sync, and AI code generation, with aggregated stats, timing breakdowns, error messages, schema diffs, and direct links. Analysis edit history is preserved so you can always go back.
Also Shipped
File Uploads & Images in Chat
Upload CSVs, Excel files, and images directly into copilot sessions via drag-and-drop or paste.
Multi-Tab Dashboard Performance
Dashboards now build one tab at a time instead of all at once. Progressive results, no timeouts.
Workspace Admin Mode
One toggle to give all workspace members admin privileges within that workspace.
Download Options
Image and CSV export dropdown on every analysis card. Native tooltips replaced with instant popovers.
New User Onboarding
A choice modal on first sign-in: Quick Start with sandbox data, Connect Your Own Data, or Skip.